Analysis of Wednesday's Trades
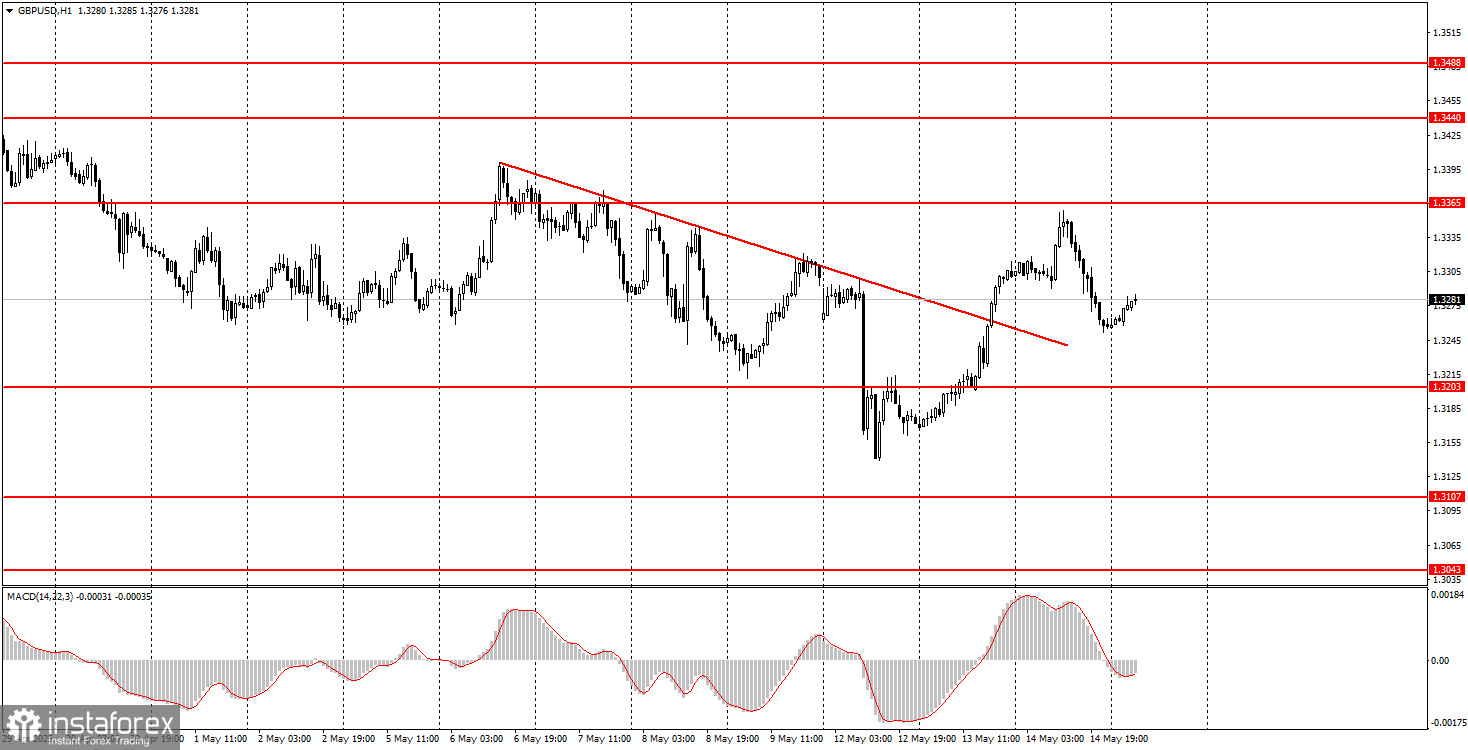
1H Chart of GBP/USD
The GBP/USD pair continued its upward movement throughout Wednesday, despite the absence of any specific fundamental reasons. The day before, a U.S. inflation report came in below expectations, formally suggesting a possible softening of the Federal Reserve and Jerome Powell's stance on monetary policy. However, we believe the market was again looking for an excuse to sell the dollar. Since when does a minimally weaker-than-expected inflation report drive the market for an entire day? Why was the UK unemployment report ignored? Why is the Fed's position not being considered, especially since Jerome Powell clearly stated that no easing is expected in the near term and that inflation will rise almost inevitably? Thus, before the downward trend had time to begin on the hourly TF, it immediately ended. A look at the 4-hour chart shows that the pair has been trading more sideways than downward for several weeks. The market remains deeply skeptical of the U.S. dollar.
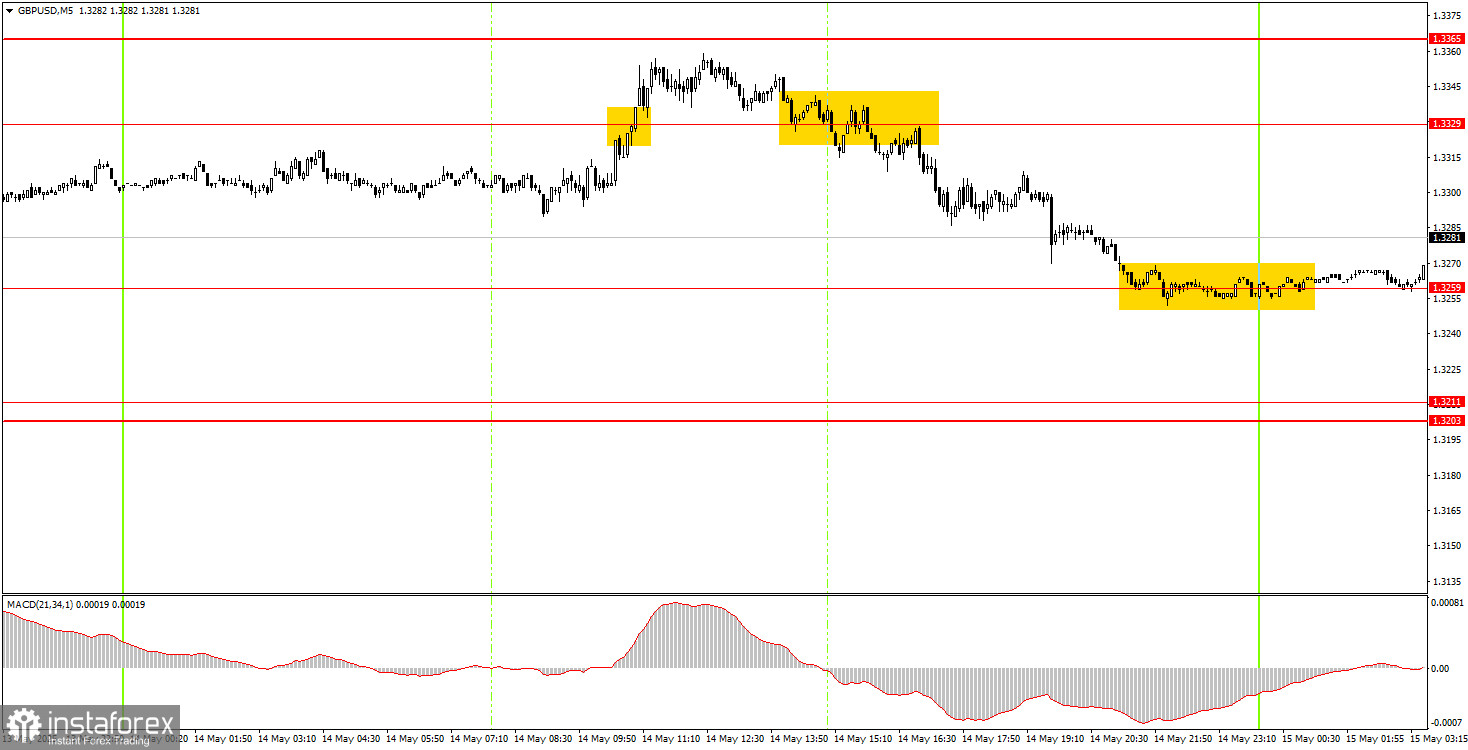
5M Chart of GBP/USD
On Wednesday, two trading signals were formed in the 5-minute timeframe. Initially, the pair broke above the 1.3329 level but only advanced 15 pips — not enough to place a breakeven Stop Loss. The next move was a consolidation below the 1.3329 level, and this signal proved valid, as the price dropped to the nearest target at 1.3259 by the end of the day. As a result, the second trade offset the loss of the first and yielded a small overall profit.
Trading Strategy for Thursday:
On the hourly timeframe, the GBP/USD pair continues to be influenced primarily by Donald Trump's actions and remains quite skeptical of his policies. It's worth remembering that even the signing of a trade agreement between the U.S. and the UK is more of a benefit for the dollar, not the pound, because it's the dollar that has previously weakened on every piece of news about tariffs and sanctions. Now, the dollar should be recovering on any news of trade war de-escalation. However, the market still doesn't trust the American currency.
On Thursday, the GBP/USD pair will likely trade based more on technical factors, even though the macroeconomic backdrop will be relatively busy. Still, it's safe to assume the market will again look for any excuse to sell the dollar.
On the 5-minute timeframe, the following levels are in play: 1.2848–1.2860, 1.2913, 1.2980–1.2993, 1.3043, 1.3102–1.3107, 1.3203–1.3211, 1.3259, 1.3329, 1.3365, 1.3421–1.3440, 1.3488, 1.3537, 1.3580–1.3598. In the UK, GDP and industrial production reports are set to be released on Thursday. However, we have already observed that traders seemed unconcerned by this week's weak unemployment report. In the U.S., key reports include retail sales and the Producer Price Index.
Core Trading System Rules:
- Signal Strength: The shorter the time it takes for a signal to form (a rebound or breakout), the stronger the signal.
- False Signals: If two or more trades near a level result in false signals, subsequent signals from that level should be ignored.
- Flat Markets: In flat conditions, pairs may generate many false signals or none at all. It's better to stop trading at the first signs of a flat market.
- Trading Hours: Open trades between the start of the European session and the middle of the US session, then manually close all trades.
- MACD Signals: On the hourly timeframe, trade MACD signals only during periods of good volatility and a clear trend confirmed by trendlines or trend channels.
- Close Levels: If two levels are too close (5–20 pips apart), treat them as a support or resistance zone.
- Stop Loss: Set a Stop Loss to breakeven after the price moves 20 pips in the desired direction.
Key Chart Elements:
Support and Resistance Levels: These are target levels for opening or closing positions and can also serve as points for placing Take Profit orders.
Red Lines: Channels or trendlines indicating the current trend and the preferred direction for trading.
MACD Indicator (14,22,3): A histogram and signal line used as a supplementary source of trading signals.
Important Events and Reports: Found in the economic calendar, these can heavily influence price movements. Exercise caution or exit the market during their release to avoid sharp reversals.
Forex trading beginners should remember that not every trade will be profitable. Developing a clear strategy and practicing proper money management are essential for long-term trading success.