EUR/USD 5-Minute Analysis
On Friday, the EUR/USD currency pair traded higher. The dollar has been falling for two consecutive weeks, and the market shows an unrelenting desire to resume the uptrend that began at the start of the year. The market still has no reason or motivation to reverse this trend. For several weeks, incoming information suggested the possibility that the global trade war initiated by Trump might transition into a more peaceful, moderate phase. However, it became clear last week that this is not the case.
Trump is once again escalating tensions. He is now dissatisfied with the world's use of Huawei chips, the lack of progress in talks with the EU (has America actually done anything to make progress?), and Apple's reluctance to return to the U.S. As a result, we have new tariffs, sanctions, threats, and ultimatums. The market continues to respond in kind — by selling the U.S. dollar, which currently nobody wants. Soon, Trump might start ordering the world not to abandon the dollar as a medium of international settlement and a "safe haven." After that, he'll probably start including mandatory U.S. bond purchases in trade deals. What's next? Trump dictating how much each country must pay to maintain a dialogue with Washington?
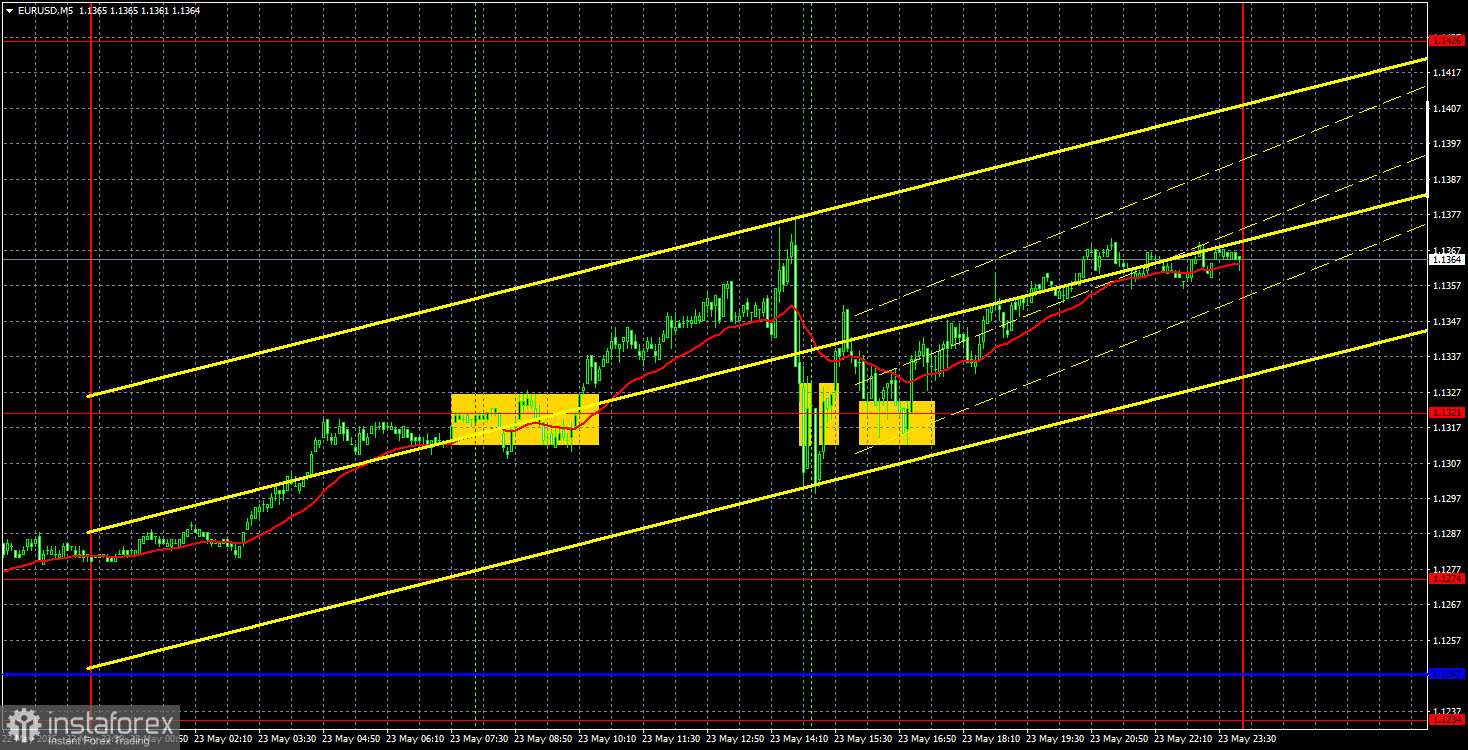
There were no macroeconomic reports on Friday, but the new tariff headlines did their job. On the 5-minute chart, trading signals were far from ideal, as the market became jittery early in the day due to fresh signs of failed de-escalation in the trade war. As a result, the dollar fell again, but price movements were again chaotic, volatile, and erratic.
COT Report
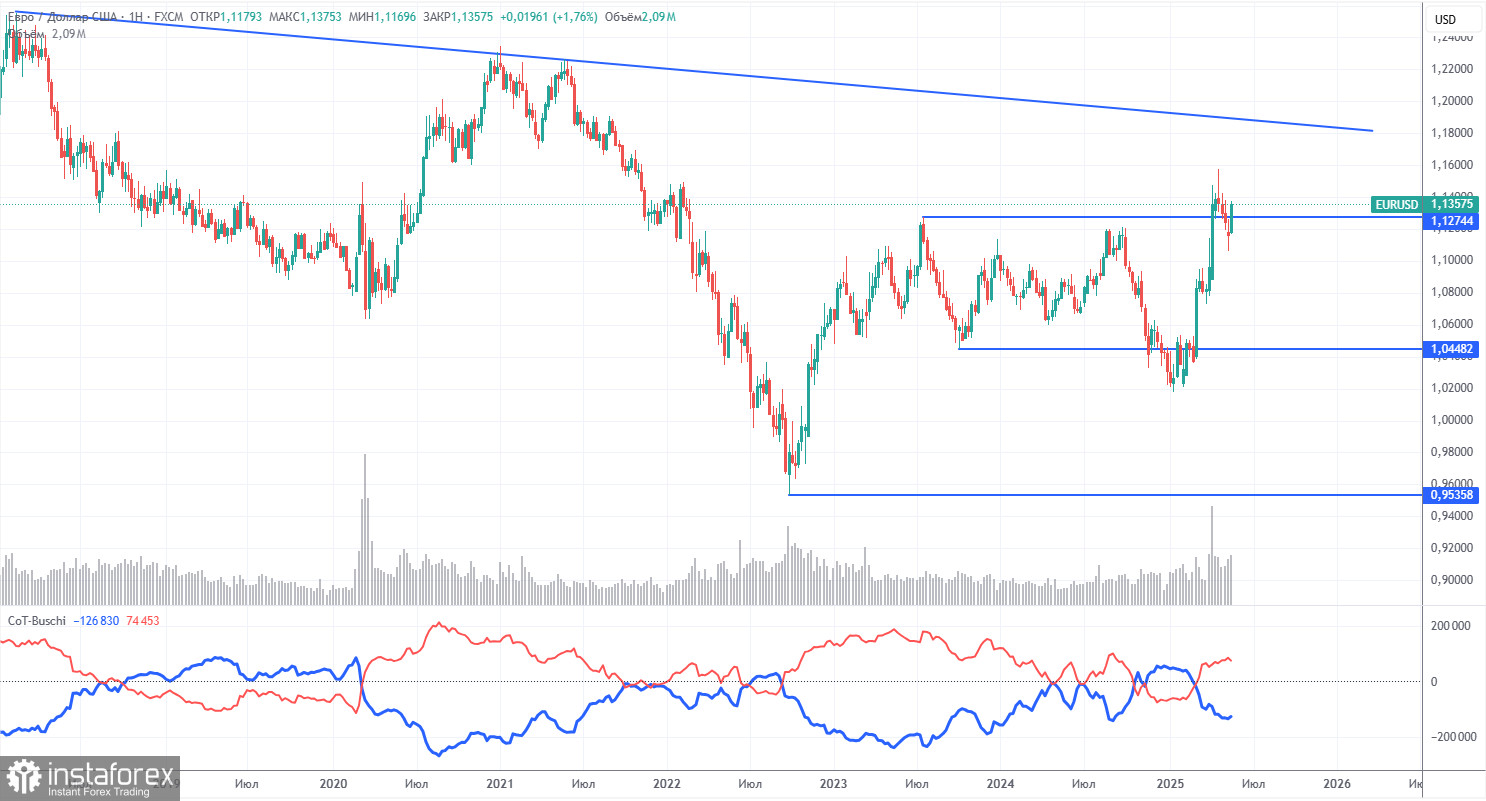
The latest COT report is dated May 20. The chart above clearly shows that the net position of non-commercial traders remained bullish for a long time. Bears barely gained dominance at the end of 2024 but quickly lost it. Since Trump took office, the dollar's value has been declining significantly. We cannot confidently say with 100% certainty that the dollar's decline will continue, but current global developments suggest that outcome.
No fundamental factors support the euro's strength; however, one significant factor contributes to the dollar's weakness. The long-term downtrend persists, though what does the trend even mean right now? The dollar could rise again once Trump ends his trade wars, but will he?
The red and blue lines have crossed again, indicating a renewed bullish sentiment in the market. During the latest reporting week, the number of long positions among "Non-commercial" traders decreased by 3,500, while short positions increased by 6,800. As a result, the net position fell by 10,300. However, the COT reports are released with a one-week delay. The market is once again actively buying now.
EUR/USD 1-Hour Analysis
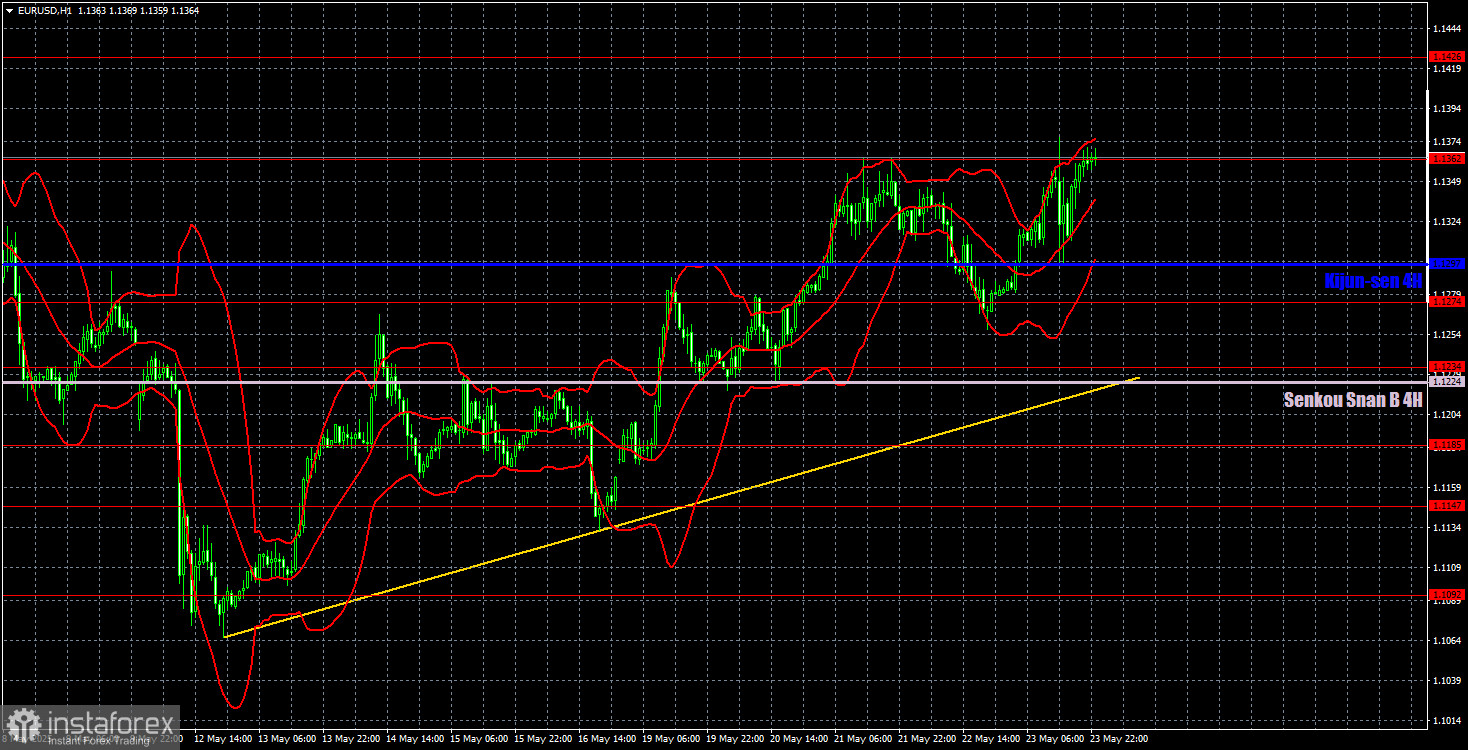
The EUR/USD pair continues its new local upward trend on the hourly timeframe. The dollar's outlook still depends on the progression of the global trade war. If trade agreements are signed and tariffs reduced, the dollar could begin to recover. But at present, tariffs are rising, and peaceful agreements are nonexistent. A dollar rebound would require a breakout below the Ichimoku lines and the trendline. The market still prefers to avoid the "Trump currency," even when there are reasons to consider it.
For May 26, the key trading levels are 1.0823, 1.0886, 1.0949, 1.1006, 1.1092, 1.1147, 1.1185, 1.1234, 1.1274, 1.1362, 1.1426, 1.1534, 1.1607, as well as the Senkou Span B line (1.1224) and the Kijun-sen line (1.1297). The Ichimoku indicator lines may shift during the day and should be considered when identifying trading signals. Don't forget to set a Stop Loss to breakeven once the price moves 15 pips in your favor — this helps minimize losses in case of a false signal.
On Monday, the only scheduled event is a speech by European Central Bank President Christine Lagarde. No other significant events are expected. While one might assume today would be flat, the market again appears intent on fleeing the dollar. As for Lagarde's speech — what could it possibly change or influence under the current conditions? The ECB has been cutting rates for eight consecutive meetings, yet the euro faces no problems.
Illustration Explanations:
- Support and resistance price levels – thick red lines where movement may end. They are not trading signal sources.
- Kijun-sen and Senkou Span B lines—These are strong Ichimoku indicator lines transferred to the hourly timeframe from the 4-hour one.
- Extremum levels – thin red lines where the price has previously rebounded. These act as trading signal sources.
- Yellow lines – trend lines, trend channels, and other technical patterns.
- COT Indicator 1 on the charts – the size of the net position for each category of traders.