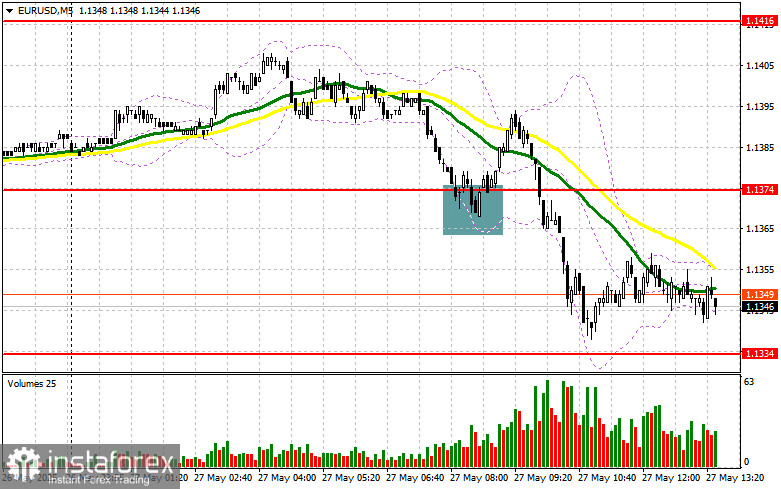
In my morning forecast, I highlighted the 1.1374 level and planned to make trading decisions based on it. Let's look at the 5-minute chart to analyze what happened. A decline followed by a false breakout around 1.1374 led to a buy entry for the euro, resulting in a 20-point rise before selling pressure returned. The technical picture was revised for the second half of the day.
To open long positions on EUR/USD:
The German GfK consumer climate index and French inflation data didn't provide much support for the euro in the first half of the day. During the U.S. session, we expect remarks from FOMC member Neel Kashkari on the need for rate cuts in the U.S., along with data on consumer confidence and durable goods orders.
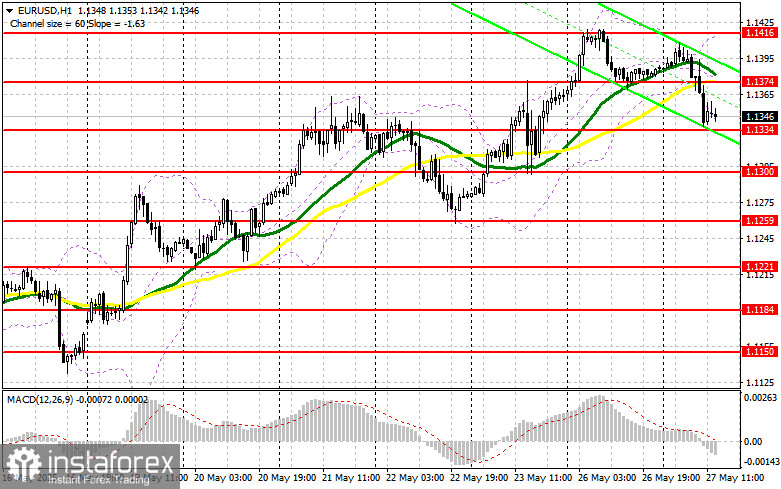
If the data is strong, the euro will likely continue falling, so it's better not to rush into buying. The key focus will be on defending the 1.1334 support. A false breakout at that level would be a signal to buy EUR/USD with the expectation of a market rebound toward 1.1374. A breakout and retest of this zone would confirm the correct entry, with an upward target at 1.1416. The furthest target would be 1.1453, where I plan to take profit.
If EUR/USD declines and there's no activity near 1.1334, pressure on the pair will intensify, leading to a deeper correction. Bears could then push the pair down to 1.1300. Only after a false breakout at that level will I consider buying the euro. Alternatively, I plan to open long positions immediately from a bounce at 1.1259, targeting an intraday rebound of 30–35 points.
To open short positions on EUR/USD:
Euro sellers made an appearance, but the technical picture hasn't changed significantly. In the event of weak data and a bullish reaction, the best option is to wait for a false breakout near the newly formed resistance at 1.1374, established earlier in the day. That would provide a signal to enter short positions against the trend, targeting a decline toward 1.1334.
A breakout and consolidation below this range would confirm a suitable selling opportunity, with a move toward 1.1300. The furthest target would be 1.1259, where I'll take profit. If EUR/USD moves higher in the second half of the day and there is no bearish activity around 1.1374, where the moving averages currently align in favor of the bears, buyers could push the pair back toward the weekly high at 1.1416. I'll only consider selling there after a failed consolidation. Alternatively, I plan to open short positions immediately from a rebound at 1.1453, targeting a 30–35 point downward correction.
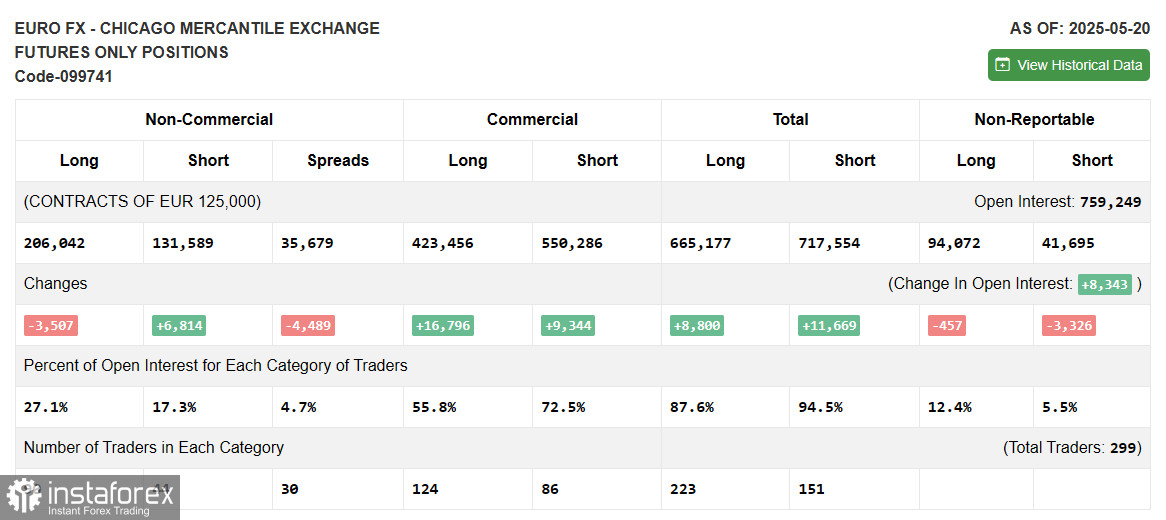
COT Report (Commitment of Traders) – May 20:
The report showed an increase in short positions and a reduction in longs. Given that EU authorities are actively working to reach a trade deal with the U.S., which even led to a postponement of higher tariffs until July, the euro has a decent chance of strengthening in the near future. Add to that the Federal Reserve's dovish stance, and the chances of a dollar rally diminish further.
According to the COT report, long non-commercial positions dropped by 3,507, to 206,042. Short non-commercial positions increased by 6,814, to 131,589. The gap between long and short positions narrowed by 4,489.
Indicator Signals:
Moving Averages Trading is taking place below the 30 and 50-period moving averages, which indicates a further decline for the pair.
Note: The author uses hourly chart (H1) settings for moving averages, which may differ from the classic daily (D1) definitions.
Bollinger Bands In case of a decline, the lower band around 1.1334 will act as support.
Indicator Definitions:
- Moving Average (MA): Determines the current trend by smoothing out volatility and noise.
- 50-period MA (marked in yellow)
- 30-period MA (marked in green)
- MACD (Moving Average Convergence/Divergence):
- Fast EMA – 12-period
- Slow EMA – 26-period
- Signal line (SMA) – 9-period
- Bollinger Bands: Measures price volatility around a moving average. Period – 20
- Non-commercial traders: Speculators such as individual traders, hedge funds, and large institutions who use the futures market for speculative purposes and meet specific criteria.
- Long non-commercial positions: Total long open interest held by non-commercial traders
- Short non-commercial positions: Total short open interest held by non-commercial traders
- Net non-commercial position: The difference between long and short non-commercial positions.