GBP/USD 5-Minute Analysis
On Wednesday, the GBP/USD currency pair continued a sluggish downward movement, which this time lacked any fundamental support. As a reminder, on Monday, the dollar might see increased demand due to Trump's leniency toward the EU, and on Tuesday, the U.S. durable goods orders report turned out to be less disastrous than expected. Formally, these two reasons could have justified a minor strengthening of the U.S. dollar. However, we've already seen this modest strengthening, and in recent months, the market has used almost any factor or news against the dollar. Therefore, it remains challenging to forecast further dollar growth, even after a 1,500-point decline over just a few months.
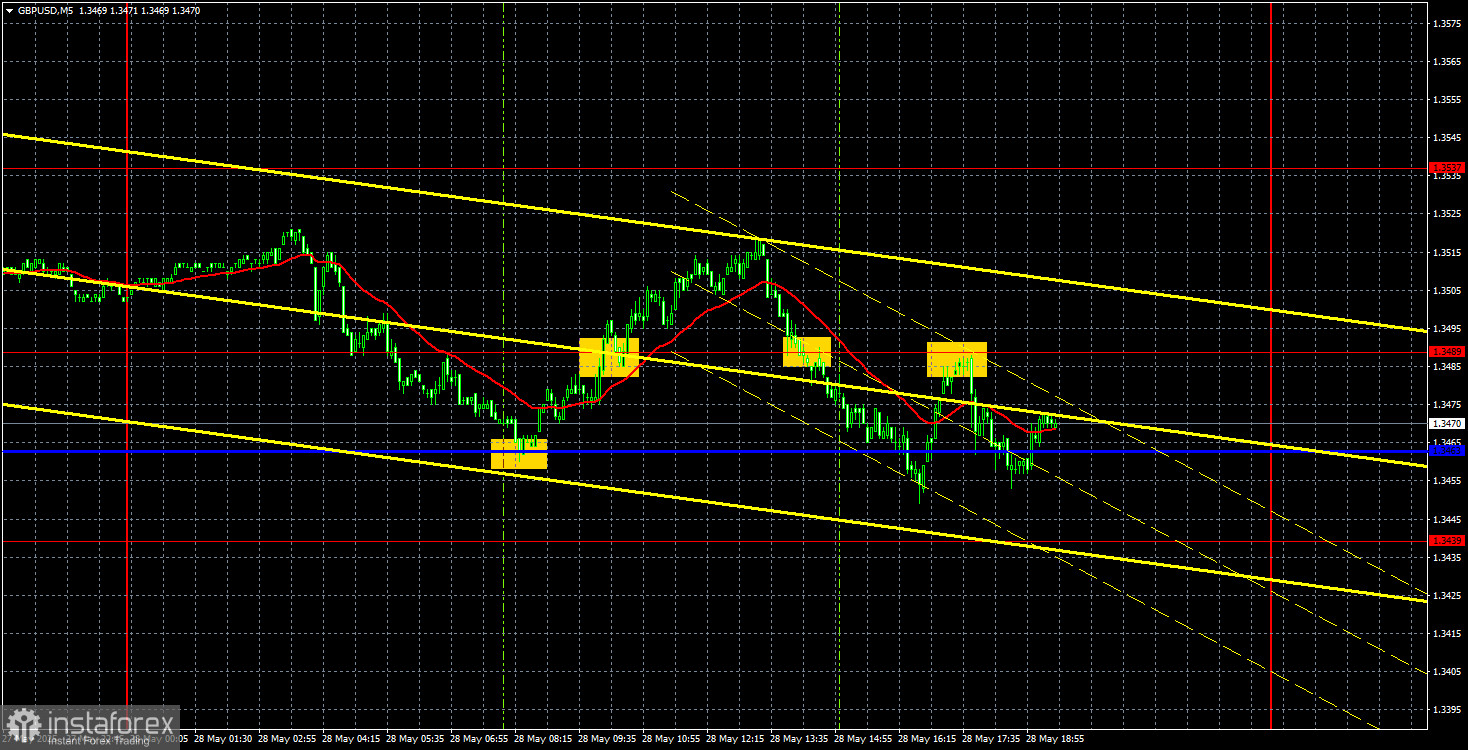
There were no noteworthy macroeconomic events on Wednesday. In the evening, the minutes from the latest FOMC meeting were released, which, as usual, failed to provoke any reaction from traders. The price is currently hovering near the lower boundary of the ascending channel, so it will either break below it—suggesting the start of a new downtrend—or bounce from it, signaling a potential resumption of the pound's upward movement.
On the 5-minute chart, it is evident that the dollar struggles to gain value. The price is being forced downward—likely so that positions can be re-entered at more attractive levels. Given the lack of trade war de-escalation, it's hard to imagine any major player currently building long positions on the dollar. On Wednesday, the pair formed one decent buy signal near the critical line, which resulted in a small profit. All subsequent signals, however, were underwhelming.
COT Report
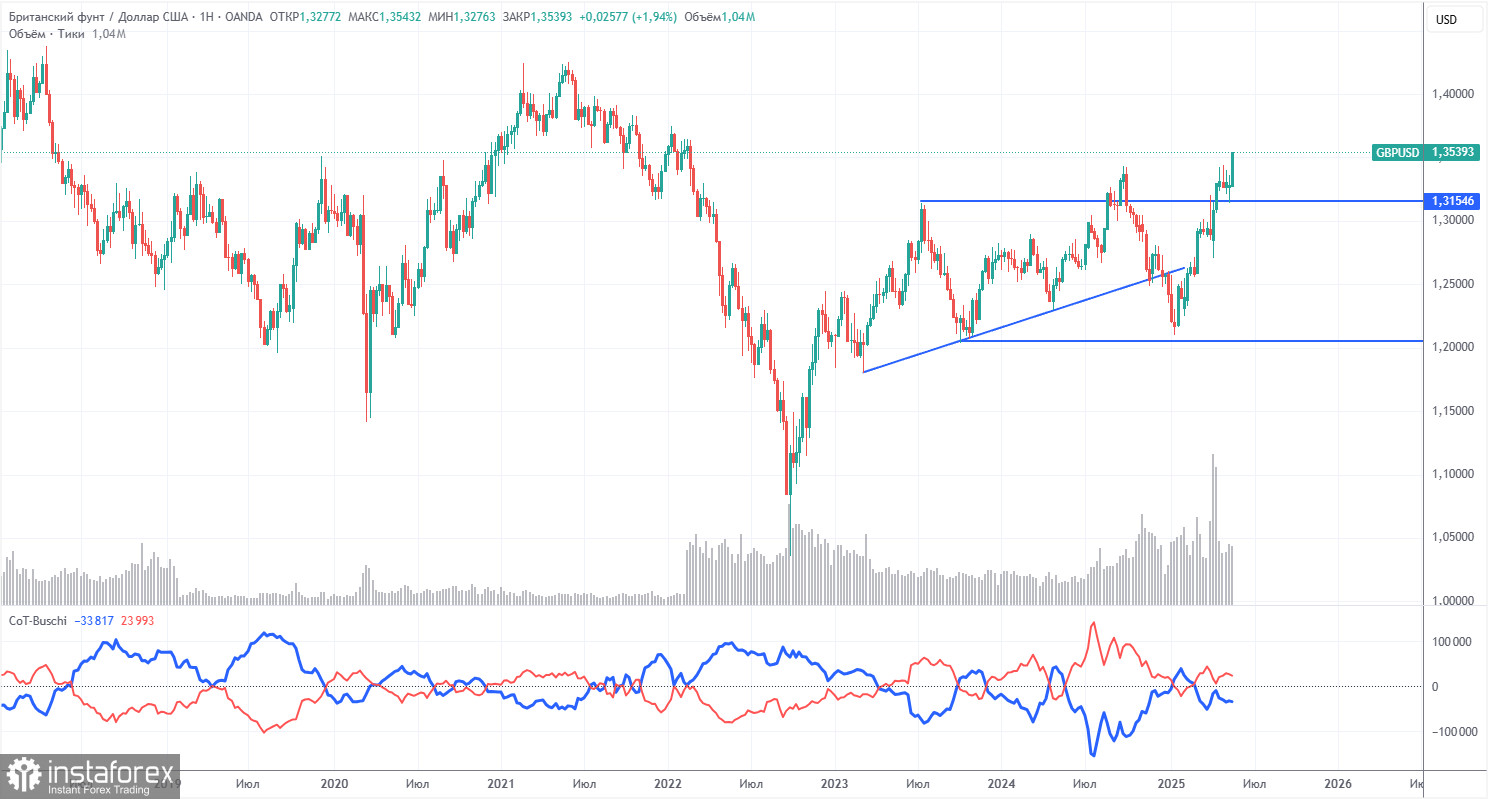
COT reports on the British pound show that commercial trader sentiment has fluctuated constantly in recent years. The red and blue lines, representing the net positions of commercial and non-commercial traders, cross each other frequently and usually hover around the zero mark. They are close together again, indicating a roughly equal number of long and short positions. However, the net position has shown steady growth over the past year and a half.
The dollar continues to weaken due to Donald Trump's policies, so market makers' demand for the pound is not particularly important now. If a global trade war de-escalation resumes, the U.S. dollar may have an opportunity to strengthen — but that opportunity still needs to be seized.
According to the latest report on the British pound, the "Non-commercial" group closed 1,400 long contracts and opened 1,800 short contracts, resulting in a 3,200 decrease in the net long position.
The pound has surged significantly recently, but it's important to understand that the only reason is Trump's policy. Once that factor is neutralized, the dollar may begin to rise again. The pound itself has no intrinsic growth drivers. Nevertheless, the "Trump factor" is enough for traders to base decisions on now.
GBP/USD 1-Hour Analysis
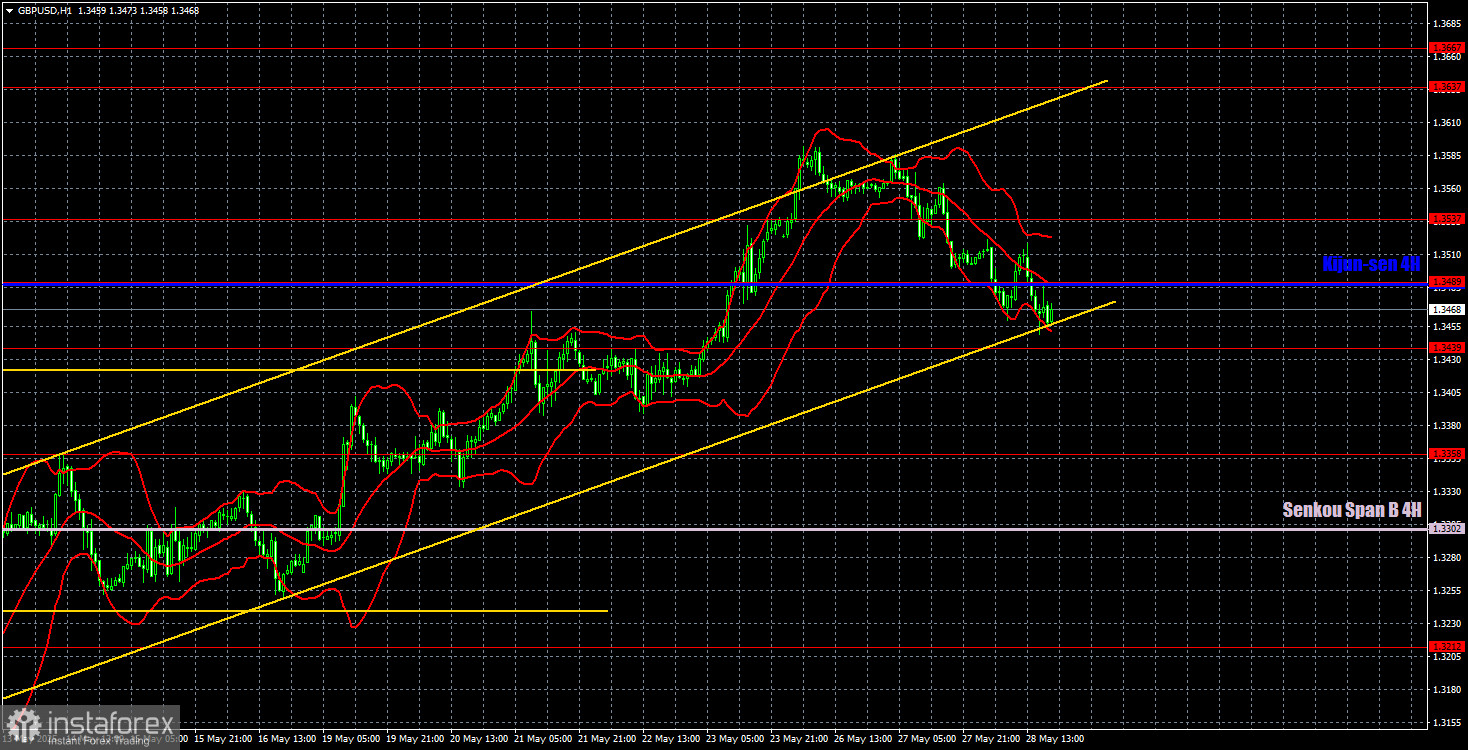
On the hourly chart, the GBP/USD pair continues to follow an upward trajectory supported by a trend channel. The pair's further direction entirely depends on Donald Trump and the evolving situation around the global trade war. The overall sentiment and market attitude toward the U.S. and its president remain strongly negative, making it difficult for the dollar to sustain meaningful gains. The dollar falls regularly, and when there's news about tariffs, it drops with double the force.
For May 29, we identify the following important trading levels: 1.2863, 1.2981–1.2987, 1.3050, 1.3125, 1.3212, 1.3288, 1.3358, 1.3439, 1.3489, 1.3537, 1.3637–1.3667, and 1.3741. The Senkou Span B line (1.3302) and the Kijun-sen line (1.3487) may also serve as signal levels. It is recommended to place a Stop Loss at breakeven once the price moves 20 pips in the right direction. The Ichimoku indicator lines may shift during the day, which must be considered when determining trading signals.
No significant events are scheduled in the UK on Thursday, and in the U.S., the only item of interest might be the second estimate of Q1 GDP. However, objectively, this report is not particularly important or impactful. We will most likely continue to observe low-volatility movements. Technical factors will dominate the market on Thursday.
Illustration Explanations:
- Support and resistance price levels – thick red lines where movement may end. They are not trading signal sources.
- Kijun-sen and Senkou Span B lines—These are strong Ichimoku indicator lines transferred to the hourly timeframe from the 4-hour one.
- Extremum levels – thin red lines where the price has previously rebounded. These act as trading signal sources.
- Yellow lines – trend lines, trend channels, and other technical patterns.
- COT Indicator 1 on the charts – the size of the net position for each category of traders.