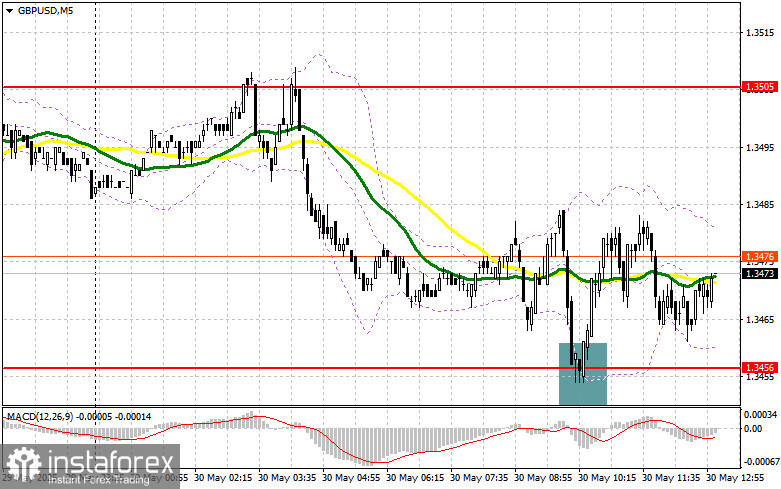
In my morning forecast, I focused on the 1.3456 level and planned to make market entry decisions from there. Let's look at the 5-minute chart and see what happened. A decline followed by a false breakout confirmed the correct entry point for buying the pound, resulting in a 30-point rise. The technical outlook was not revised for the second half of the day.
To Open Long Positions on GBP/USD:
The pound remained within the range, which was expected, especially given the lack of important fundamental statistics. Ahead, we have data releases on the Core Personal Consumption Expenditures (PCE) Price Index, changes in personal spending, changes in personal income, and the University of Michigan Consumer Sentiment Index. A rise in inflation would support the U.S. dollar, as it would reduce the likelihood of the Fed lowering rates. In the event of a decline in the pound, I would prefer to act around the same support at 1.3456, which worked well in the first half of the day. A false breakout there will provide a good entry point for long positions aiming for a recovery toward resistance at 1.3505. A breakout and retest of this range from the top would offer a new entry point for long positions with a prospect of updating 1.3555, which would bring back a bullish market. The furthest target would be around 1.3602, where I plan to fix profits. If GBP/USD declines and there is no buyer activity around 1.3456 in the second half of the day, pressure on the pound could return. In that case, only a false breakout around 1.3416 would be a suitable signal for opening long positions. Otherwise, I would buy GBP/USD immediately on a rebound from 1.3382, aiming for an intraday correction of 30–35 points.
To Open Short Positions on GBP/USD:
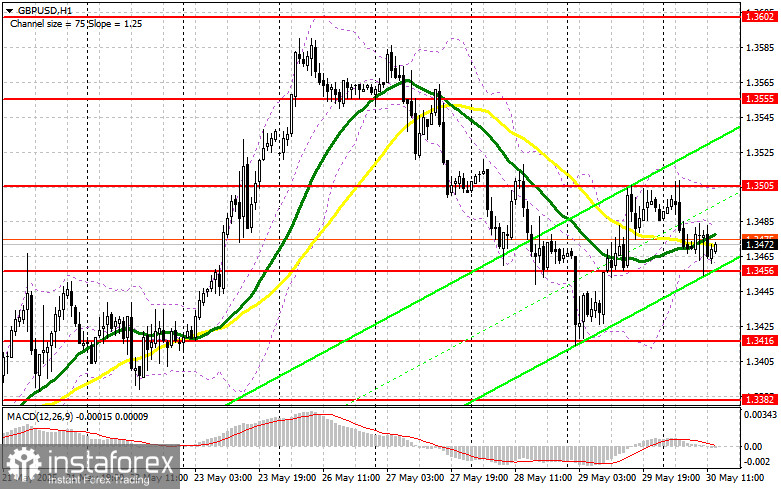
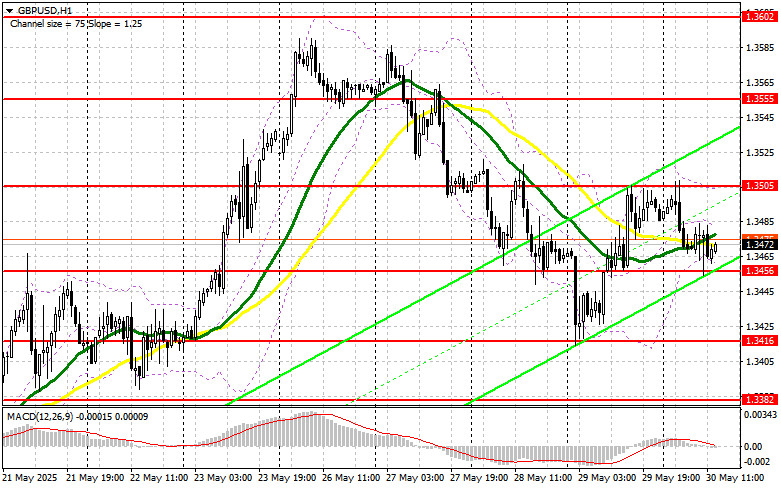
Sellers tried but failed to achieve anything significant. The further outlook will depend on the U.S. data, but I personally don't expect the technical picture to change much afterward. In the event of an upward spike in GBP/USD, I plan to act only after a false breakout around the 1.3505 resistance level. This would be enough for an entry point to sell, targeting a decline toward the 1.3456 support. A breakout and retest from below would trigger stop orders and open the way to 1.3416. The furthest target would be around 1.3382, where I plan to fix profits. If demand for the pound persists in the second half of the day and sellers fail to assert themselves at 1.3505, then it's better to postpone sales until a test of resistance at 1.3555. I would open short positions there only after a false breakout. If there is no downward movement even there, I would look for short positions on a rebound from 1.3602, aiming for an intraday correction of 30–35 points.
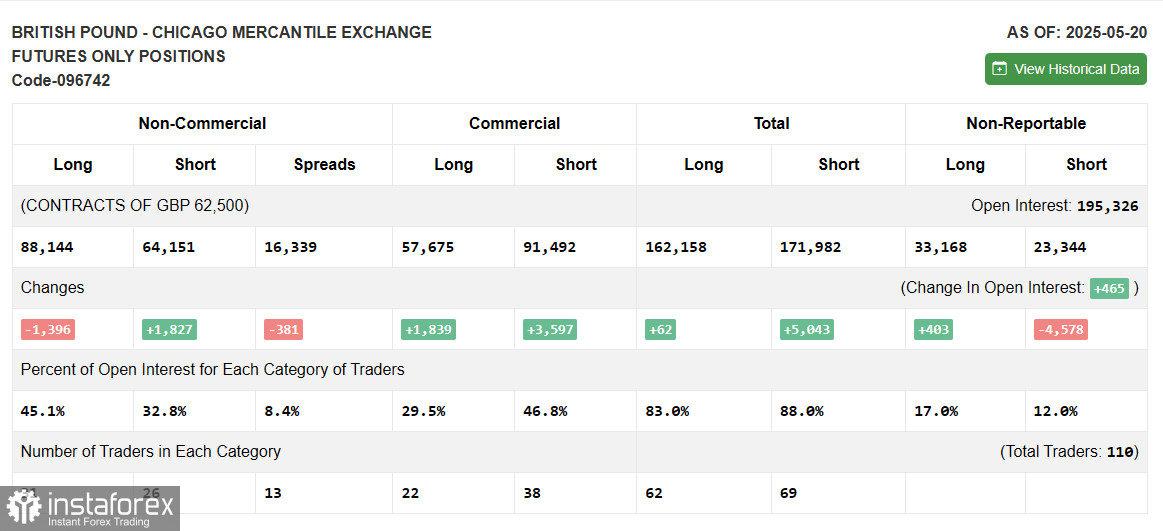
The COT (Commitments of Traders) report for May 20 showed a decrease in long positions and an increase in short positions. After the UK and the U.S. signed a trade agreement, demand for the pound remained relatively strong, even though the Bank of England plans to lower interest rates. Similar plans by the Federal Reserve impact the strength of the U.S. dollar, allowing the pound to continue its upward trend. In the latest COT report, long non-commercial positions fell by 1,396 to 88,144, while short non-commercial positions rose by 1,827 to 64,151, narrowing the gap between longs and shorts by 381.
Indicator Signals:
Moving Averages: Trading is occurring around the 30- and 50-day moving averages, indicating market uncertainty.
Note: The moving average periods and prices discussed refer to the H1 chart and differ from the classic daily moving averages on the D1 chart.
Bollinger Bands: In the event of a decline, the lower boundary of the indicator around 1.3456 will act as support.
Indicator Descriptions:
- Moving Average: Defines the current trend by smoothing out volatility and noise. Period – 50 (marked yellow on the chart).
- Moving Average: Defines the current trend by smoothing out volatility and noise. Period – 30 (marked green on the chart).
- MACD (Moving Average Convergence/Divergence): Fast EMA – 12; Slow EMA – 26; SMA – 9.
- Bollinger Bands: Period – 20.
- Non-commercial traders: Speculators such as individual traders, hedge funds, and large institutions using the futures market for speculative purposes under specific requirements.
- Long non-commercial positions: Total number of open long positions held by non-commercial traders.
- Short non-commercial positions: Total number of open short positions held by non-commercial traders.
- Net non-commercial position: The difference between short and long positions held by non-commercial traders.