Analysis of Monday's Trades
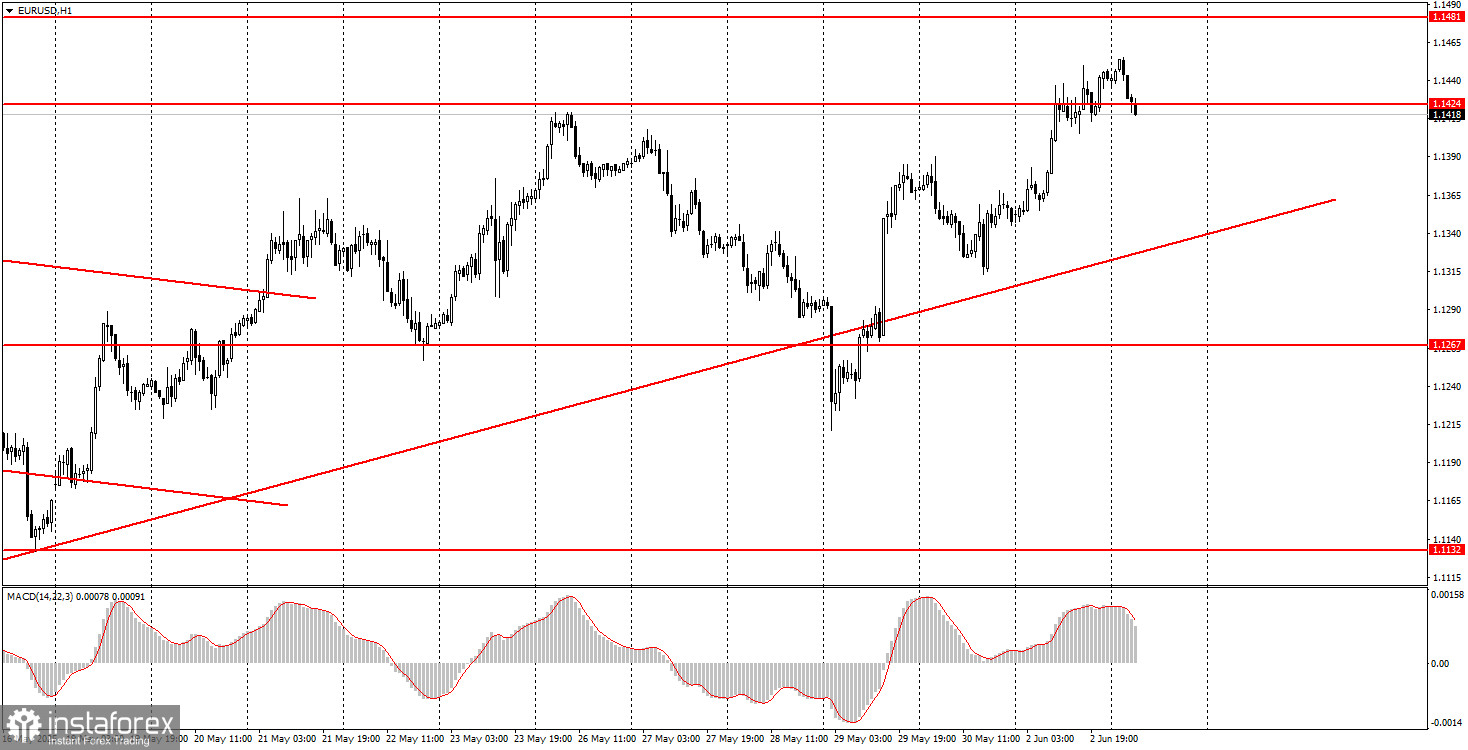
1H Chart of EUR/USD
The EUR/USD currency pair traded higher on Monday. We had warned that the dollar would likely decline again after Trump announced increased tariffs on steel and aluminum imports. Consequently, EUR/USD moved upward. On Monday, the price climbed almost all day, with the movement starting overnight. Essentially, the tariff hike signals another escalation of the trade war. Since the US dollar has been declining on this factor for several months while ignoring virtually all other factors, what else could have been expected on Monday? Also, several manufacturing PMI indices for Germany, the EU, and the US were published yesterday; however, they did not affect overall trader sentiment. Macroeconomic data, as a whole, are currently of limited interest. Nonetheless, it's worth noting that the most important ISM index in the US came out weaker than forecast, adding further pressure on the dollar.
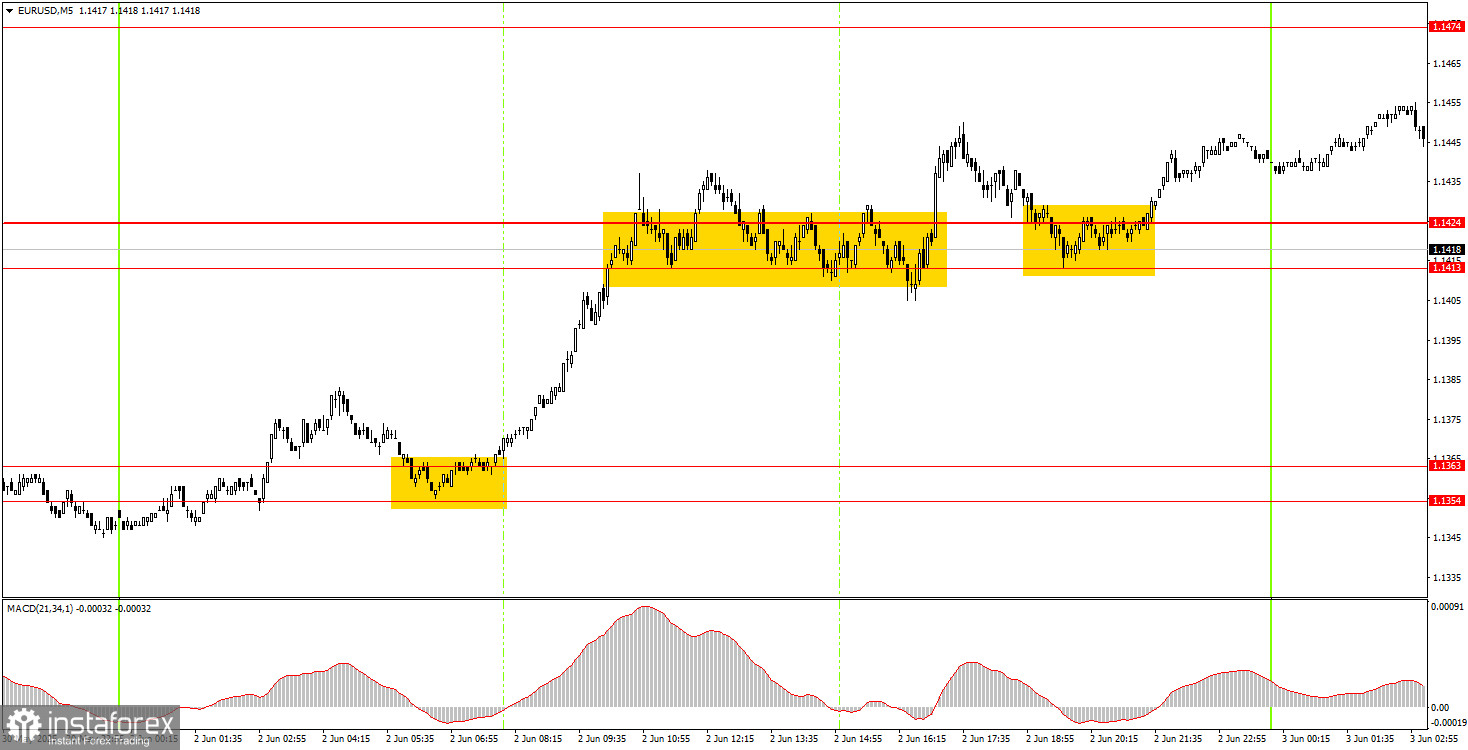
5M Chart of EUR/USD
At the start of the European trading session on Monday, a perfect buy signal was formed in the 5-minute timeframe. The price rebounded from the 1.1354–1.1363 area, leading to growth toward the 1.1413–1.1424 zone. A semblance of a flat market followed, but there were hardly any false signals. The price resumed growth from the 1.1413–1.1424 area, although this movement was relatively weak.
Trading Strategy for Tuesday:
In the hourly timeframe, the EUR/USD pair has broken through the ascending trendline; however, the uptrend that started during Donald Trump's presidency continues. The fact that Trump is still the US president is enough for the dollar to keep falling. For the market, that's already a compelling reason to flee from the dollar. If Trump continues to threaten, issue ultimatums, and impose/raise tariffs, the market will have few alternatives. Trump's tariffs have not been canceled, so the trade war situation has not improved.
On Tuesday, the EUR/USD pair could move in either direction since Trump's tariff hikes have already been priced in. Thus, today's trading should be based on technical factors — unless Trump announces new tariffs.
On the 5-minute timeframe, the following levels should be considered: 1.0940–1.0952, 1.1011, 1.1088, 1.1132–1.1140, 1.1198–1.1218, 1.1267–1.1292, 1.1354–1.1363, 1.1413–1.1424, 1.1474–1.1481, 1.1513, 1.1548, 1.1571, 1.1607–1.1622. Inflation data for May is set to be released in the Eurozone on Tuesday; however, it is not anticipated to significantly impact the market at this time. The European Central Bank is almost certain to cut rates on Thursday, which is not expected to affect the euro negatively. The JOLTs job openings report will be published in the US, but it also holds little significance for the market — especially under current conditions.
Core Trading System Rules:
- Signal Strength: The shorter the time it takes for a signal to form (a rebound or breakout), the stronger the signal.
- False Signals: If two or more trades near a level result in false signals, subsequent signals from that level should be ignored.
- Flat Markets: In flat conditions, pairs may generate many false signals or none at all. It's better to stop trading at the first signs of a flat market.
- Trading Hours: Open trades between the start of the European session and the middle of the US session, then manually close all trades.
- MACD Signals: On the hourly timeframe, trade MACD signals only during periods of good volatility and a clear trend confirmed by trendlines or trend channels.
- Close Levels: If two levels are too close (5–20 pips apart), treat them as a support or resistance zone.
- Stop Loss: Set a Stop Loss to breakeven after the price moves 15 pips in the desired direction.
Key Chart Elements:
Support and Resistance Levels: These are target levels for opening or closing positions and can also serve as points for placing Take Profit orders.
Red Lines: Channels or trendlines indicating the current trend and the preferred direction for trading.
MACD Indicator (14,22,3): A histogram and signal line used as a supplementary source of trading signals.
Important Events and Reports: Found in the economic calendar, these can heavily influence price movements. Exercise caution or exit the market during their release to avoid sharp reversals.
Forex trading beginners should remember that not every trade will be profitable. Developing a clear strategy and practicing proper money management are essential for long-term trading success.