Trade Analysis for Thursday:
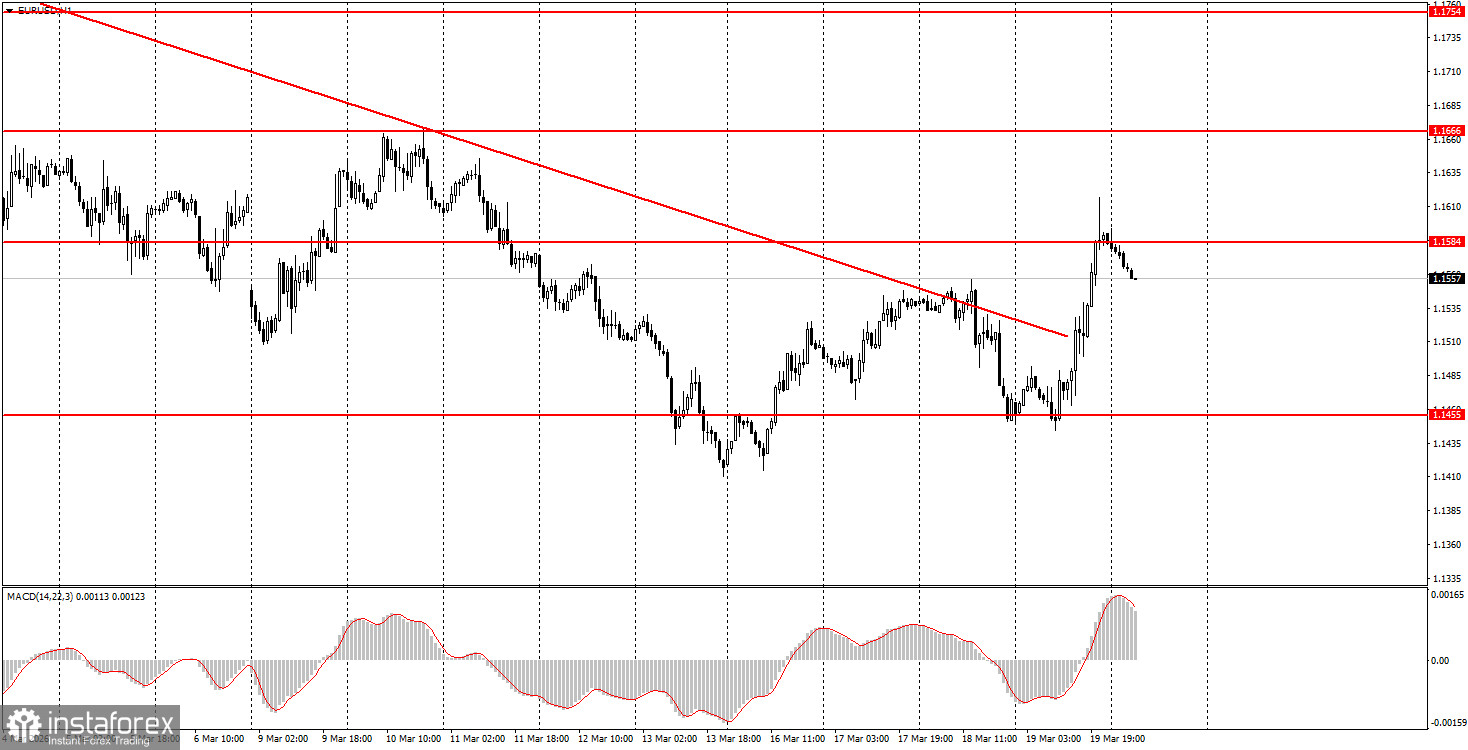
1H Chart of the EUR/USD Pair
The EUR/USD currency pair showed a fairly strong upward move on Thursday, raising more questions than it answered for existing ones. Yesterday, the ECB took no significant decisions and did not signal a potential tightening of monetary policy in 2026, yet the European currency soared. What was this related to? It's possible we witnessed a simple swing of a corrective move, as the overall downward trend in the euro has persisted for a month and a half. The market may have interpreted the increased inflation forecasts for the current year as a signal of possible monetary policy tightening. Alternatively, the geopolitical factor may have exhausted its usefulness for traders and the dollar. The descenduing trendline has been breached; therefore, technically, an upward trend is beginning. We fully support the rise of the pair, but it is currently crucial to understand whether the geopolitical factor will continue to influence the market.
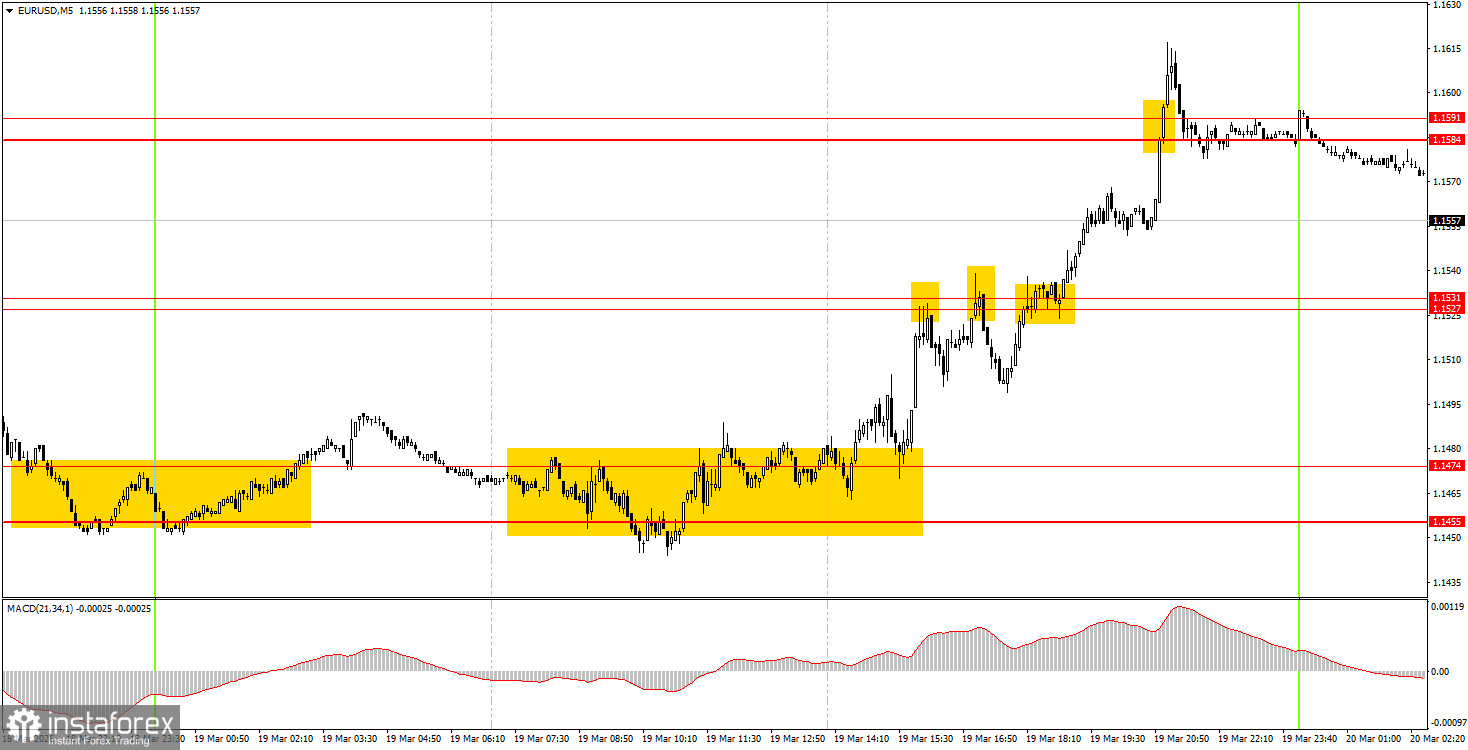
5M Chart of the EUR/USD Pair
On the 5-minute time frame, quite a number of trading signals were formed on Thursday. Throughout the European session, the pair traded sideways but still generated a buy signal in the 1.1455-1.1474 range. Just an hour later, it hit the nearest target—the area of 1.1527-1.1531—bouncing off it twice before breaking through. Thus, beginner traders received a false sell signal (which did not result in a loss, as the price moved in the correct direction by 15 pips) and a buy signal that led to gains of about 50 pips.
How to Trade on Friday:
On the hourly time frame, the downward trend is complete, but we may be dealing with a simple upward correction. A long-term upward trend resumed at the beginning of 2026, so we still expect a new medium-term rise in the euro. The overall fundamental background remains very challenging for the US dollar, as confirmed by reports on the labor market, GDP, and unemployment. However, at the moment, geopolitics and inflation are the primary concerns for the market.
On Friday, novice traders may consider short positions if the price consolidates below the area of 1.1584-1.1591 (or bounces from that area from below), targeting 1.1527-1.1531 and 1.1474. A bounce from the area of 1.1527-1.1531 or a consolidation above the area of 1.1584-1.1591 will allow for opening long positions.
On the 5-minute time frame, the following levels should be considered: 1.1267-1.1292, 1.1354-1.1363, 1.1413, 1.1455-1.1474, 1.1527-1.1531, 1.1584-1.1591, 1.1655-1.1666, 1.1745-1.1754, 1.1830-1.1837, and 1.1899-1.1908. On Friday, there are no significant events scheduled in the Eurozone or the US, which may prompt the price to enter a downward correction.
Key Principles of the Trading System:
- The strength of a signal is determined by the time it takes to form the signal (bounce or breakout). The less time taken, the stronger the signal.
- If two or more trades have been opened at a particular level based on false signals, all subsequent signals from that level should be ignored.
- In a flat market, any pair can form many false signals or none at all. In any case, at the first signs of a flat trend, it is best to stop trading.
- Trading deals are to be opened during the period between the start of the European session and the mid-American session, after which all trades should be closed manually.
- On the hourly timeframe, it is preferable to trade based on signals from the MACD indicator only when there is good volatility and a trend confirmed by a trend line or trend channel.
- If two levels are positioned too close together (5-20 pips apart), they should be considered a support or resistance area.
- Upon moving 15 pips in the correct direction, a Stop Loss should be set to breakeven.
What to Look for on the Charts:
Price levels of support and resistance are levels that serve as targets when opening buys or sells. Take Profit levels can be placed around them.
Red lines represent channels or trend lines that show the current trend and indicate the direction in which it is preferable to trade now.
The MACD indicator (14,22,3) – the histogram and the signal line – is a supporting indicator that can also be used as a source of signals.
Important speeches and reports (always included in the news calendar) can significantly affect the movement of the currency pair. Therefore, during their release, trading should be done with utmost caution, or traders should exit the market to avoid sharp price reversals against the previous movement.
Beginning traders in the forex market should remember that not every trade can be profitable. Developing a clear strategy and effective money management are the keys to long-term trading success.