empty
 
 
02.06.2025 12:36 PM
Bitcoin's technical outlook appears promising

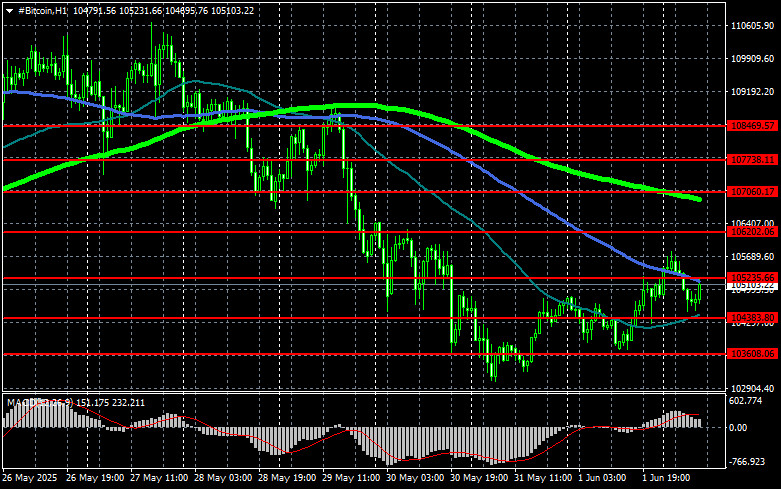
Bitcoin appears to have found a bottom near $104,000 and is currently trading around $104,500 in early June.

This image is no longer relevant

It is evident that the cryptocurrency is positioned at a psychological and technical inflection point, one that could determine the success or failure of the next bullish trend.

In the short term, technical indicators like the RSI and MACD suggest that the strong bullish momentum may be gradually weakening. However, the long-term outlook remains optimistic, with growing conviction among analysts and market participants that we could be in the early stages of a new supercycle.

Key support for Bitcoin remains around $103,000, with a more substantial base forming near $97,600. If BTC can hold above the $103,000–$105,000 range, there is potential for a fresh rally toward $115,000. Conversely, a breakdown below $103,000 could lead to a deeper correction, targeting the $93,000–$97,000 range.

Even in this bearish case, it should not be seen as the end of the broader uptrend, but rather as an indication that the market may require more time to consolidate before resuming upward momentum.

This image is no longer relevant

Trading recommendations:

Buyers of BTC are currently aiming to reclaim $105,200, a level that would pave the way for $106,200, followed closely by $107,000. The ultimate upside target is $107,700, a breakout above which would strengthen the bullish market structure. In the event of a decline, buyers are expected to re-enter around $104,300. A drop below this area could quickly push BTC toward $103,600, with a deeper target at $102,800.

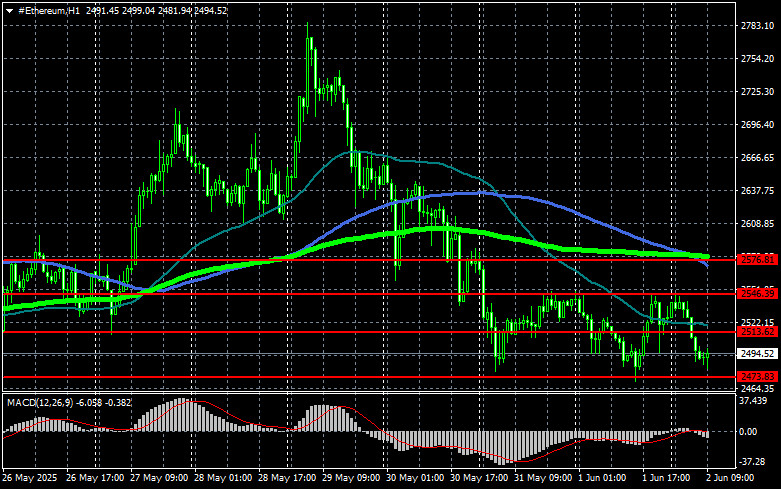
As for ETH, clear consolidation above $2,513 would open the way toward $2,546, with the final upside target at $2,576, a level that would confirm the formation of a bullish trend.

Should ETH decline, support is seen around $2,473. A move below this area could drag ETH down to $2,441, with a final downside target near $2,412.

This image is no longer relevant

What we see on trading charts:

  • Red lines: support and resistance zones expected to cause either a pause or a sharp price move
  • Green line: 50-day moving average
  • Blue line: 100-day moving average
  • Light green line: 200-day moving average

The crossing or testing of these moving averages often signals trend reversals or momentum shifts in the market.

Jakub Novak,
انسٹافاریکس کا تجزیاتی ماہر
© 2007-2025
انسٹافاریکس کے ساتھ کرپٹو کرنسی کی معاملاتی تبدیلیوں سے کمائیں۔
میٹا ٹریڈر 4 ڈاؤن لوڈ کریں اور اپنی پہلی ٹریڈ کھولیں۔
  • Grand Choice
    Contest by
    InstaForex
    InstaForex always strives to help you
    fulfill your biggest dreams.
    مقابلہ میں شامل ہوں
  • چانسی ڈیپازٹ
    اپنے اکاؤنٹ میں 3000 ڈالر جمع کروائیں اور حاصل کریں$1000 مزید!
    ہم جون قرعہ اندازی کرتے ہیں $1000چانسی ڈیپازٹ نامی مقابلہ کے تحت
    اپنے اکاؤنٹ میں 3000 ڈالر جمع کروانے پر موقع حاصل کریں - اس شرط پر پورا اُترتے ہوئے اس مقابلہ میں شرکت کریں
    مقابلہ میں شامل ہوں
  • ٹریڈ وائز، ون ڈیوائس
    کم از کم 500 ڈالر کے ساتھ اپنے اکاؤنٹ کو ٹاپ اپ کریں، مقابلے کے لیے سائن اپ کریں، اور موبائل ڈیوائسز جیتنے کا موقع حاصل کریں۔
    مقابلہ میں شامل ہوں
  • 100 فیصد بونس
    اپنے ڈپازٹ پر 100 فیصد بونس حاصل کرنے کا آپ کا منفرد موقع
    بونس حاصل کریں
  • 55 فیصد بونس
    اپنے ہر ڈپازٹ پر 55 فیصد بونس کے لیے درخواست دیں
    بونس حاصل کریں
  • 30 فیصد بونس
    ہر بار جب آپ اپنا اکاؤنٹ ٹاپ اپ کریں تو 30 فیصد بونس حاصل کریں
    بونس حاصل کریں

تجویز کردہ مضامین

ابھی فوری بات نہیں کرسکتے ؟
اپنا سوال پوچھیں بذریعہ چیٹ.
Widget callback