Trade review of Wednesday:
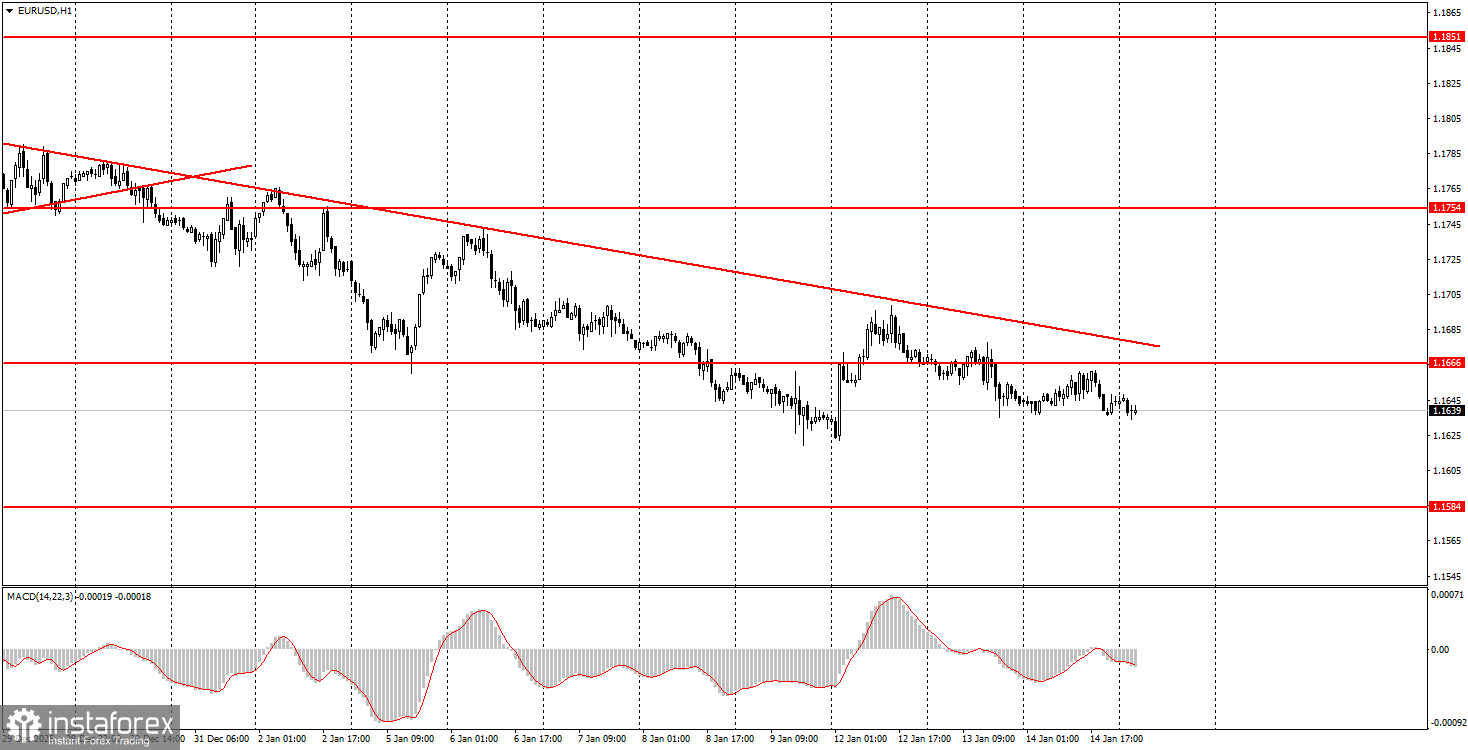
1H chart of the EUR/USD pair
The EUR/USD currency pair has at least been stable in recent weeks. Despite extremely weak movement and the lack of reaction to important events and reports, the euro is moving in one direction — south. We cannot say this makes the traders' task much easier. For example, yesterday's volatility was 26 pips, which is an anti-record for recent years and further proof of what we have been saying for several months: the market is in a total flat. On the daily chart, the price has been trading for seven months in the sideways channel 1.1400–1.1830. Hardly anyone seriously believes that, in seven months, there were no important events in the world, the EU, or the US that could have sparked a trending move. Even yesterday, two medium-importance US reports were published, and Donald Trump said an attack on Iran was cancelled for now. As we see, there was no market reaction to any of these events. And in the new year, a mass of such events has been ignored.
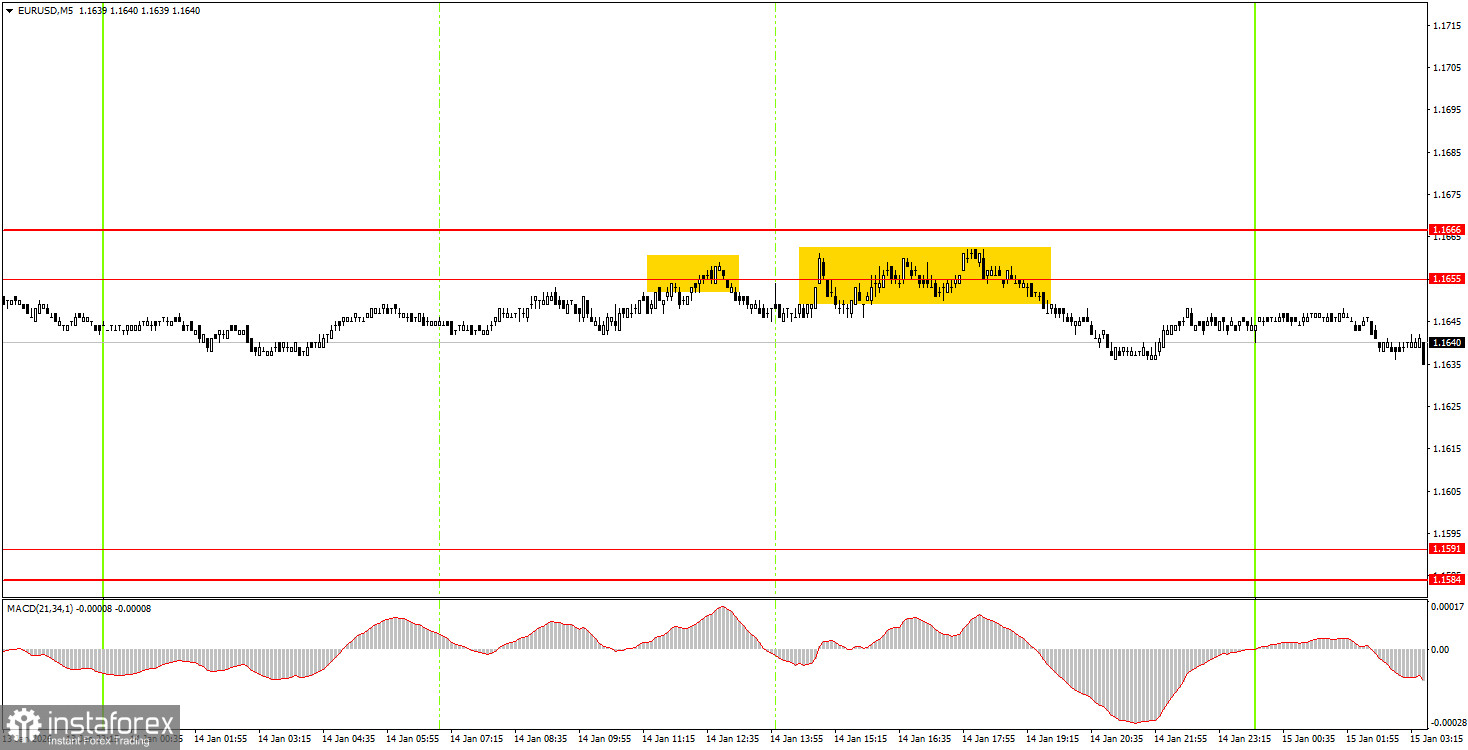
5M chart of the EUR/USD pair
On the 5-minute TF on Wednesday, two trading signals were formally formed. The price bounced twice from the 1.1655–1.1666 area, which allowed novice traders to open short positions. By the end of the day, the price moved about 10 pips in the desired direction, which in current circumstances can be considered a decent profit. Recall that with any trading signals, the absence of market movement will not allow you to achieve high profit.
How to trade on Thursday:
On the hourly timeframe, the downtrend formation continues, as evidenced by the trendline. The 1.1800–1.1830 area, which is the upper boundary of the daily TF flat, could not be overcome, so the technical decline is logical and may continue down to 1.1400. The overall fundamental and macro background remains very weak for the US dollar, but the daily-TF flat plays take priority, and traders practically pay no attention to the macro background.
On Thursday, novice traders can again trade from the 1.1655–1.1666 area, because there is nothing else to do. A bounce off this area allowed opening short positions yesterday, targeting 1.1584–1.1591, and the weakness of movements forces traders to keep trades open for several days. A close above this area will make longs relevant with a target of 1.1745–1.1754.
On the 5?minute TF, consider the levels 1.1354–1.1363, 1.1413, 1.1455–1.1474, 1.1527–1.1531, 1.1550, 1.1584–1.1591, 1.1655–1.1666, 1.1745–1.1754, 1.1808, 1.1851, 1.1908, 1.1970–1.1988. Today, the EU will publish Germany's GDP for all of 2025 and industrial production for November. It is easy to assume that the reaction to these data will be minimal, if any. The US calendar is empty.
Main rules of the trading system:
- Signal strength is judged by the time required to form the signal (rebound or breakout). The less time required, the stronger the signal.
- If two or more trades were opened on false signals near a level, then all subsequent signals from that level should be ignored.
- In a flat, any pair can generate many false signals or none at all. In any case, at the first signs of a flat, it is better to stop trading.
- Trades are opened during the period between the start of the European session and the middle of the American session; after that, all trades must be closed manually.
- On the hourly timeframe, MACD-based signals should ideally be traded only when there is good volatility and a trend confirmed by a trendline or trend channel.
- If two levels are located too close to each other (5–20 pips), they should be considered as a support or resistance area.
- After the price moves 15 pips in the correct direction, place a stop loss at breakeven.
What is shown on the charts:
Support and resistance price levels — levels that serve as targets when opening buys or sells. Take Profit can be placed near them.
Red lines — channels or trendlines that reflect the current tendency and show which direction is preferable to trade now.
MACD indicator (14,22,3) — histogram and signal line — an auxiliary indicator that can also be used as a source of signals.
Important speeches and reports (always listed in the news calendar) can strongly affect a currency pair's movement. Therefore, during their release, trading should be done with maximum caution, or positions should be closed, to avoid a sharp price reversal against the preceding move.
Beginner forex traders should remember that not every trade can be profitable. Developing a clear strategy and effective money management are the keys to long-term trading success.