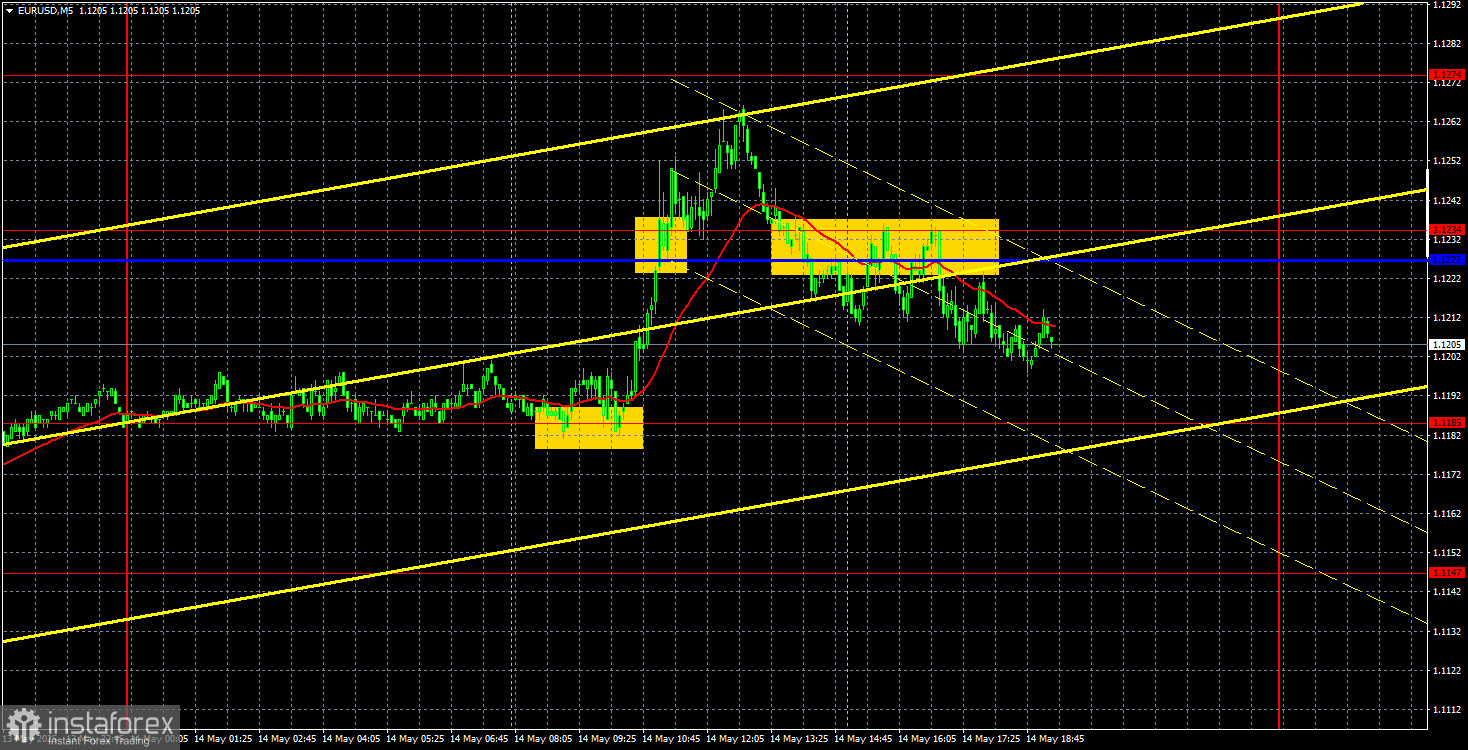
EUR/USD 5-Minute Analysis
The EUR/USD currency pair continued upward movement on Wednesday, but only briefly. In the afternoon, the euro started to decline, despite the lack of macroeconomic factors supporting such moves. Donald Trump made no new statements about the trade war but did comment on the latest inflation report. According to him, "only the blind can't see" the decline in consumer prices in the U.S.; therefore, Jerome Powell must cut the key interest rate. However, there was nothing fundamentally new in that statement.
The Federal Reserve will likely resume monetary policy easing at some point, simply because there may be no alternative. Inflation will eventually return to the 2% target, and there will be no reason to keep rates so high. However, the Fed is still in a wait-and-see mode and not without reason—it anticipates inflation may accelerate again due to Trump's tariffs. Meanwhile, Trump continues to rant about this issue. Again, nothing new.
From a technical standpoint, the downtrend remains intact, even though the last two trading days have shown a relatively strong upward correction. These types of retracements suggest that there are no real signs of the trade war ending. Even if Trump signs trade deals with all the countries on his list, that doesn't eliminate the existence of tariffs, the slowdown in the economy, and rising inflation. As a result, the dollar remains underwhelming in demand, even though it should be strengthening under normal circumstances.
Wednesday's trading signals include a rebound from the level of 1.1185 and consolidation below the area of 1.1227-1.1234. These two signals allowed traders to open longs first, then shorts. Both trades turned out to be profitable.
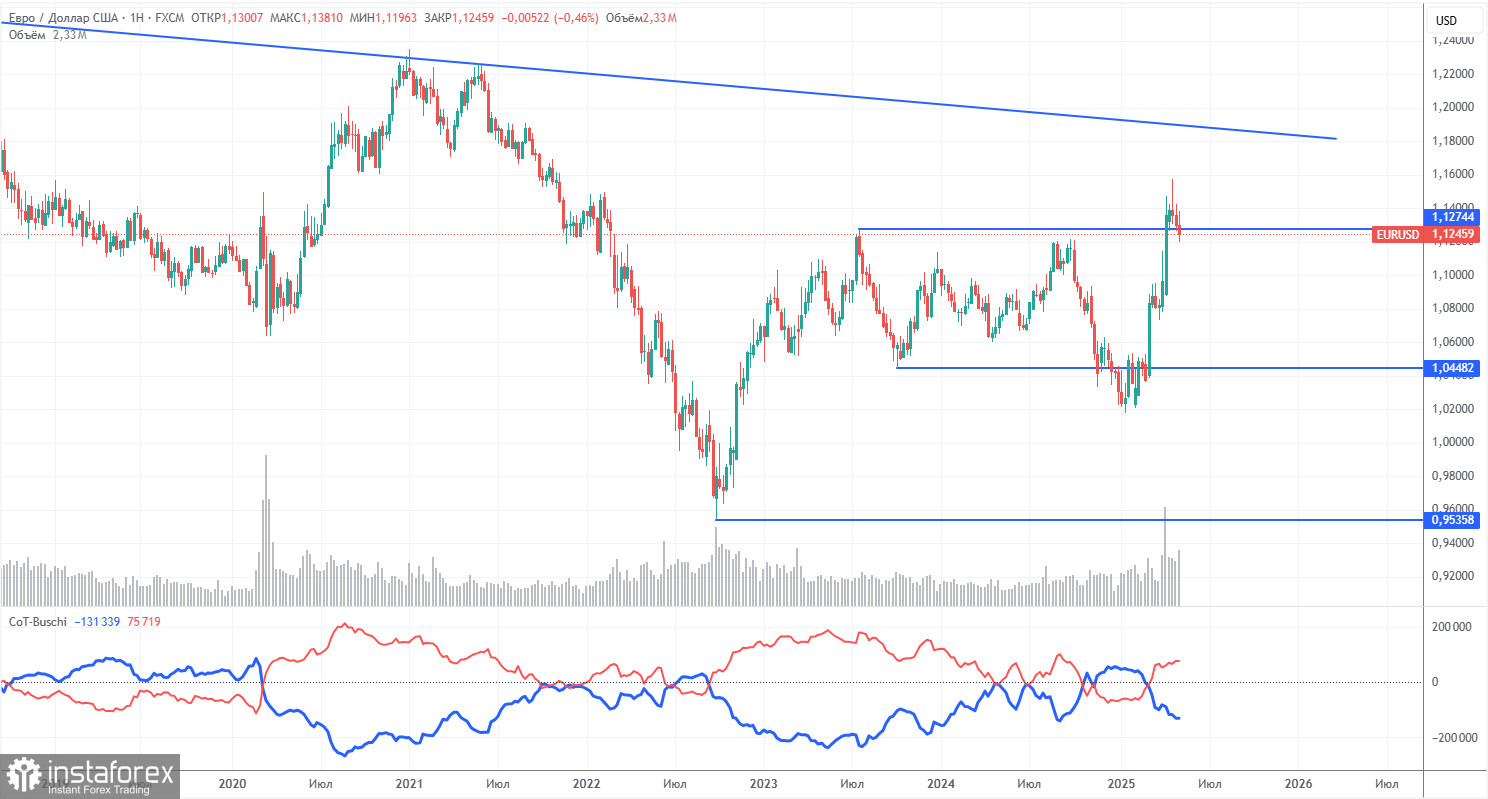
COT Report
The latest COT (Commitment of Traders) report is dated May 6. As shown in the chart above, the net position of non-commercial traders remained bullish for a long time. Bears briefly took the lead but quickly lost it. Since Trump took office, the dollar has been in free fall. We can't say with certainty that the dollar's decline will continue, and the COT reports reflect the actual sentiment of large players, which can change rapidly under current circumstances.
We still see no fundamental factors for the euro to strengthen, but one major factor remains for the dollar to fall. The pair may continue to correct for several more weeks or months, but a 16-year downtrend will not reverse quickly. Once Trump concludes his trade wars, the dollar may return to growth.
The red and blue lines have crossed again, indicating a return to a bullish trend. Over the last reporting week, the number of longs among the "non-commercial" group decreased by 2,200, and the number of shorts decreased by 2,100. Accordingly, the net position remained virtually unchanged for the week.
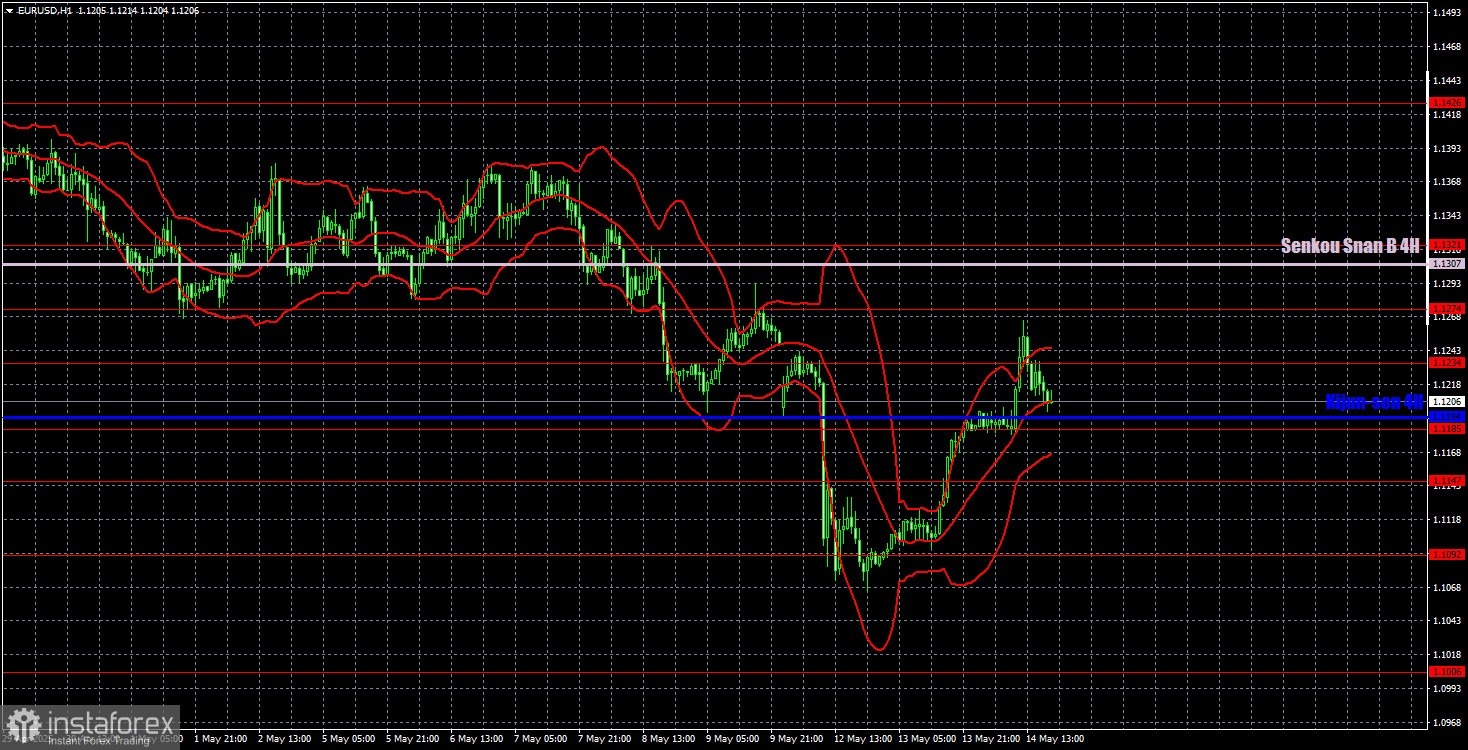
EUR/USD 1-Hour Analysis
The pair initially showed a substantial decline in the hourly time frame, followed by an equally strong correction. The prospects for further decline still depend on the global trade war narrative. If trade deals are signed and tariffs are reduced, the U.S. dollar will likely strengthen and return to levels from which it previously fell. At this stage, technical factors are less influential than geopolitical developments.
For May 15, we highlight the following levels for trading: 1.0823, 1.0886, 1.0949, 1.1006, 1.1092, 1.1147, 1.1185, 1.1234, 1.1274, 1.1321, 1.1426, 1.1534, as well as the Senkou Span B (1.1307) and Kijun-sen (1.1194) lines. The lines of the Ichimoku indicator can move during the day, which should be considered when determining trading signals. Do not forget about placing a Stop Loss order at breakeven if the price goes in the wrong direction for 15 pips. This will protect you from possible losses if the signal is false.
On Thursday, the second estimate of GDP for the first quarter and industrial production will be released in the European Union. The producer price index, unemployment claims, and retail sales data will also be published in the United States. We believe all these reports are of secondary importance. While they may provoke minor local reactions, they will not impact the overall market sentiment. And the market is still in a great deal of speculation, should we buy the dollar amid the de-escalation of the World Trade War?
Illustration Explanations:
- Support and resistance price levels – thick red lines where movement may end. They are not trading signal sources.
- Kijun-sen and Senkou Span B lines—These are strong Ichimoku indicator lines transferred to the hourly timeframe from the 4-hour one.
- Extremum levels – thin red lines where the price has previously rebounded. These act as trading signal sources.
- Yellow lines – trend lines, trend channels, and other technical patterns.
- COT Indicator 1 on the charts – the size of the net position for each category of traders.