The GBP/USD currency pair continued its upward movement on Monday. It is important to point out that the situation with the euro is rather complex and unstable. The euro has been fluctuating in recent weeks, reacting to every development in the global trade war. Due to Trump's tendency to frequently change his decisions, the euro is experiencing significant fluctuations. The upward trend that began during Trump's presidency seems to continue, though confidence in its sustainability is lacking.
The situation for the British pound is quite different. The pound continues to rise, similar to Bitcoin, and shows little reaction to the changing mood of the U.S. president. If Trump proposes raising tariffs on the EU, the dollar weakens against the British pound in the GBP/USD pair. If Trump changes his mind, that becomes his own issue — the market is not interested in reversing the narrative. Consequently, the British currency maintains its steady rise and does not attempt to adjust to Trump's ever-changing rhetoric.
In our view, the pound is currently something of a symbol of stability, even perhaps a "safe haven." It is being bought much like Bitcoin — irrationally. The UK economy hasn't shown rapid growth or breathtaking prospects. However, investors are fleeing the dollar and must shift capital into other currencies. Why not the British pound?
The Bank of England's monetary policy also supports the pound's growth. Just a couple of weeks ago, the British central bank cut its key rate for the second time this year, and literally days later, UK inflation jumped to 3.5%. Traders quickly concluded that the BoE would pause further monetary easing, giving the pound new momentum.
It's also worth noting that the market continues to ignore all negative factors for the pound and positive ones for the dollar. This alone complicates analysis and forecasting significantly. The Federal Reserve has maintained a hawkish stance throughout 2025, but this has done nothing to help the dollar. How much longer can this pattern last? The market won't ignore dollar-positive news forever.
So, for now, one can forecast further strengthening of the pound, but what happens if the market suddenly starts responding to Fed policy, tariff reductions with China, or macroeconomic data from the UK and the U.S., which don't always favor the pound?
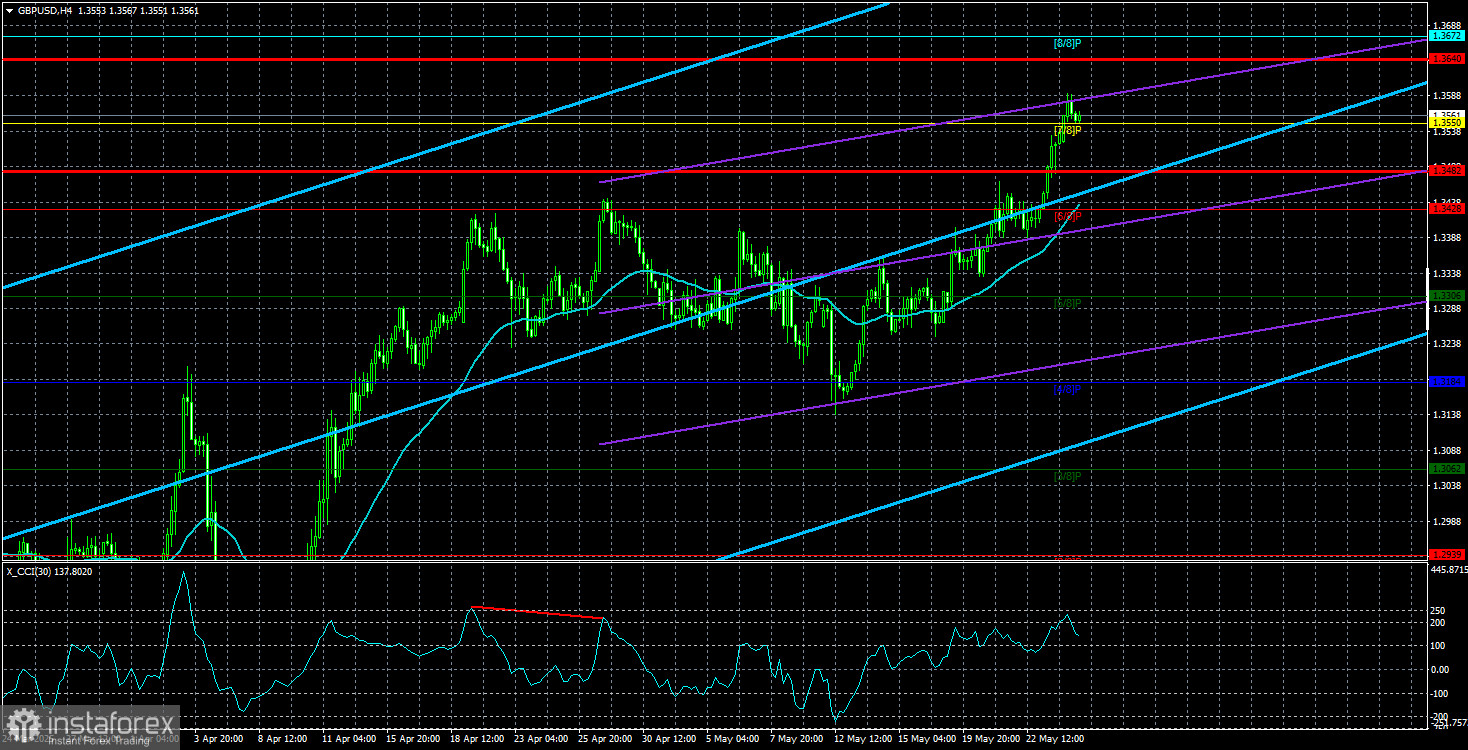
From a technical perspective, we're looking at a five-month rally that began even before Trump took office — about a week earlier. During this period, the pound has risen nearly 1,500 pips, with only minor corrections along the way. You'd think a deep correction is overdue. But the market continues to use every excuse to sell dollars and buy pounds. On the 4-hour chart, there's currently no justification for selling. In most cases, the macroeconomic backdrop doesn't matter to the market. In short, the situation is both simple and highly complicated at the same time.
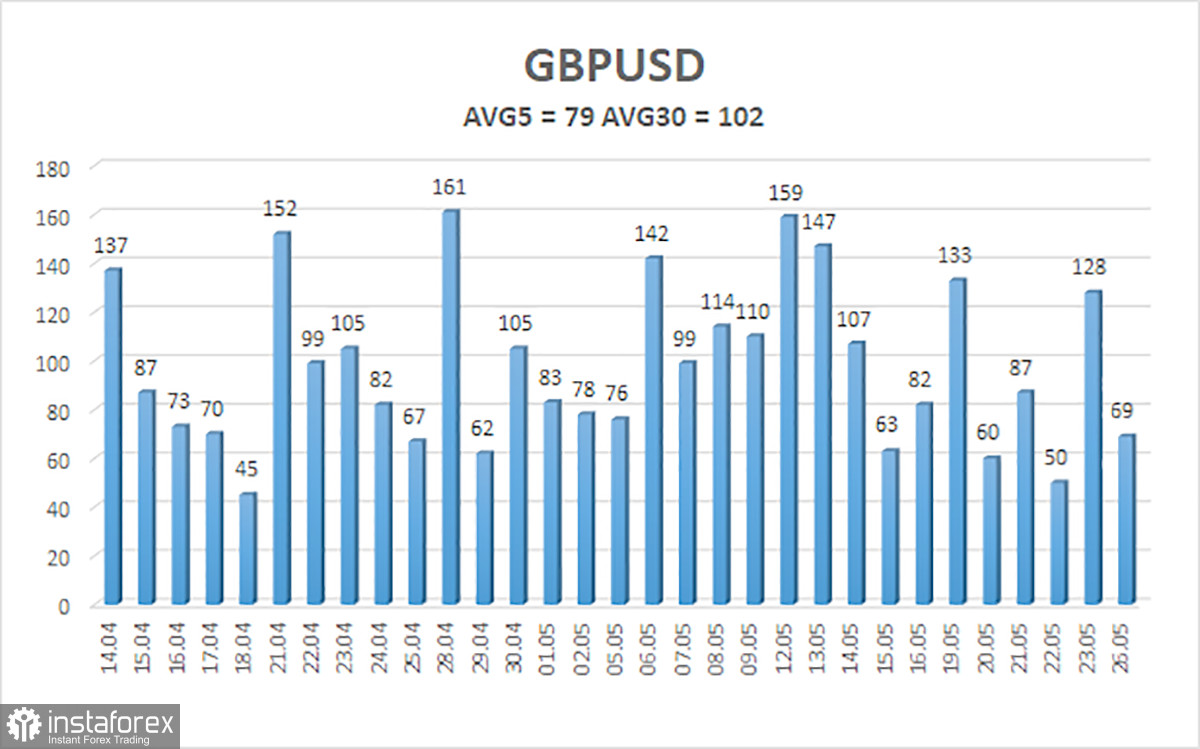
The average volatility of the GBP/USD pair over the last five trading days is 79 pips, which is considered "moderate." On Tuesday, May 27, we expect movement from 1.3482 to 1.3640. The long-term regression channel is pointed upward, confirming a clear upward trend. The CCI indicator has not recently entered extreme zones.
Nearest Support Levels:
S1 – 1.3550
S2 – 1.3428
S3 – 1.3306
Nearest Resistance Levels:
R1 – 1.3672
R2 – 1.3794
R3 – 1.3916
Trading Recommendations:
The GBP/USD pair maintains its upward trend and continues to rise regardless of the news. The de-escalation of the trade conflict began and ended quickly, but market distrust toward the dollar remains. Every new Trump decision is interpreted negatively by the market. Therefore, long positions are possible with targets at 1.3640 and 1.3672. A break below the moving average would allow for short positions with a target of 1.3306. From time to time, the U.S. dollar may show minor corrections, but a more substantial rally will require clear signs of real de-escalation in the global trade war.
Explanation of Illustrations:
Linear Regression Channels help determine the current trend. If both channels are aligned, it indicates a strong trend.
Moving Average Line (settings: 20,0, smoothed) defines the short-term trend and guides the trading direction.
Murray Levels act as target levels for movements and corrections.
Volatility Levels (red lines) represent the likely price range for the pair over the next 24 hours based on current volatility readings.
CCI Indicator: If it enters the oversold region (below -250) or overbought region (above +250), it signals an impending trend reversal in the opposite direction.