EUR/USD 5-Minute Analysis
The EUR/USD currency pair traded very calmly on Friday, with no news of market-moving scale. In recent months, traders have paid little attention to routine macroeconomic data. Almost every week, news of global significance arrives, overshadowing even Federal Reserve meetings. Last Thursday, the market was in disarray when one U.S. court canceled Donald Trump's tariffs, and another overturned that decision. As a result, traders first frantically bought dollars, hoping for a resolution to the international trade conflict, and then just as frantically sold dollars again when those hopes were crushed.
However, these events are now history. On Saturday, Trump announced another tariff increase — on steel and aluminum imports. Thus, we can expect a very lively week ahead. We have repeatedly warned that Trump's "grace periods" and the mutual tariff reductions between China and the U.S. do not signal de-escalation. When Trump imposes tariffs, he wants more money in the budget. When Trump demands a deal, he still wants more money in the budget. One way or another, Trump wants money, and it doesn't matter who provides it.
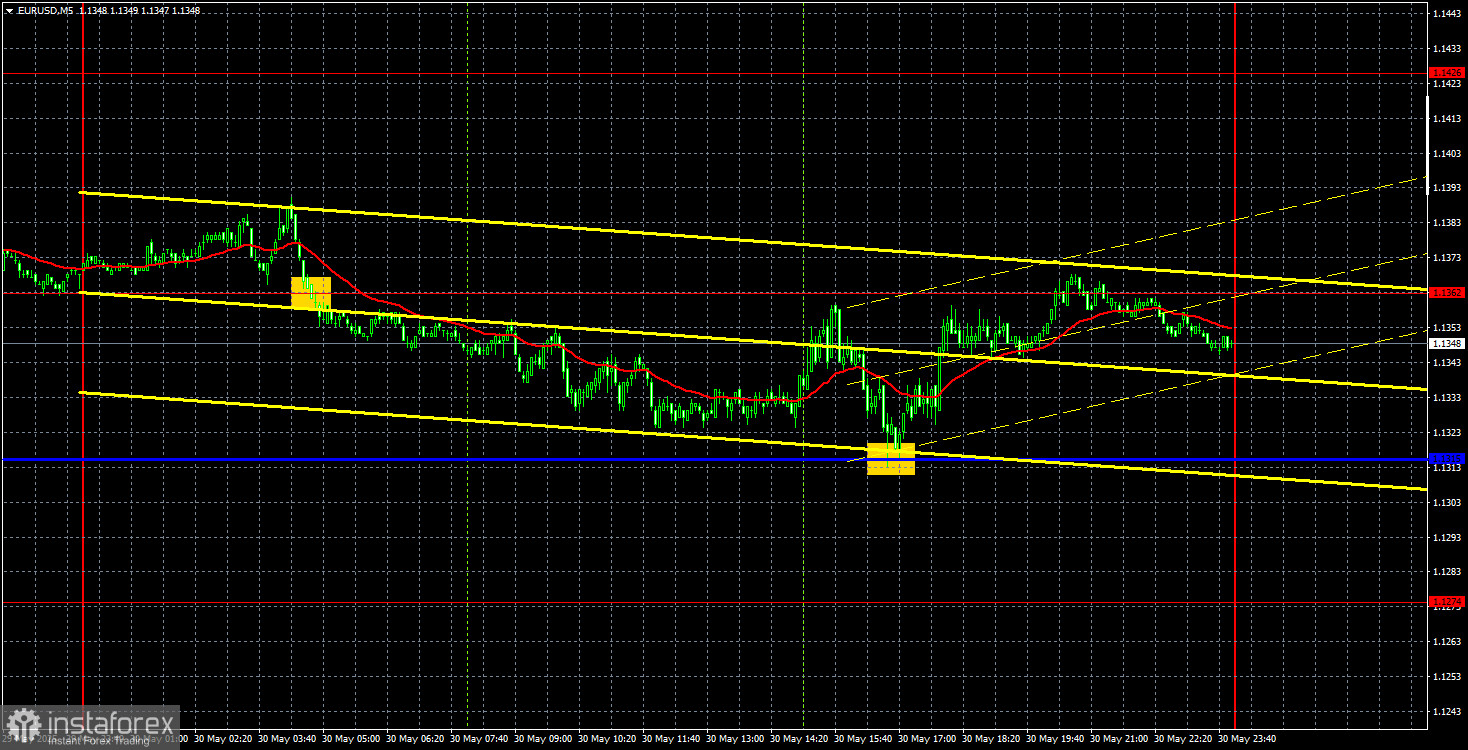
Two trading signals were formed on Friday's 5-minute timeframe. During the night, the price settled below the 1.1362 level, and during the day, it reached the nearest target level—the Kijun-sen line. A rebound also followed from the critical line, permitting the opening of long positions. By the end of the day, the pair returned to the 1.1362 level. Thus, two trades could have been opened on Friday, each closing at Take Profit and generating profit.
COT Report
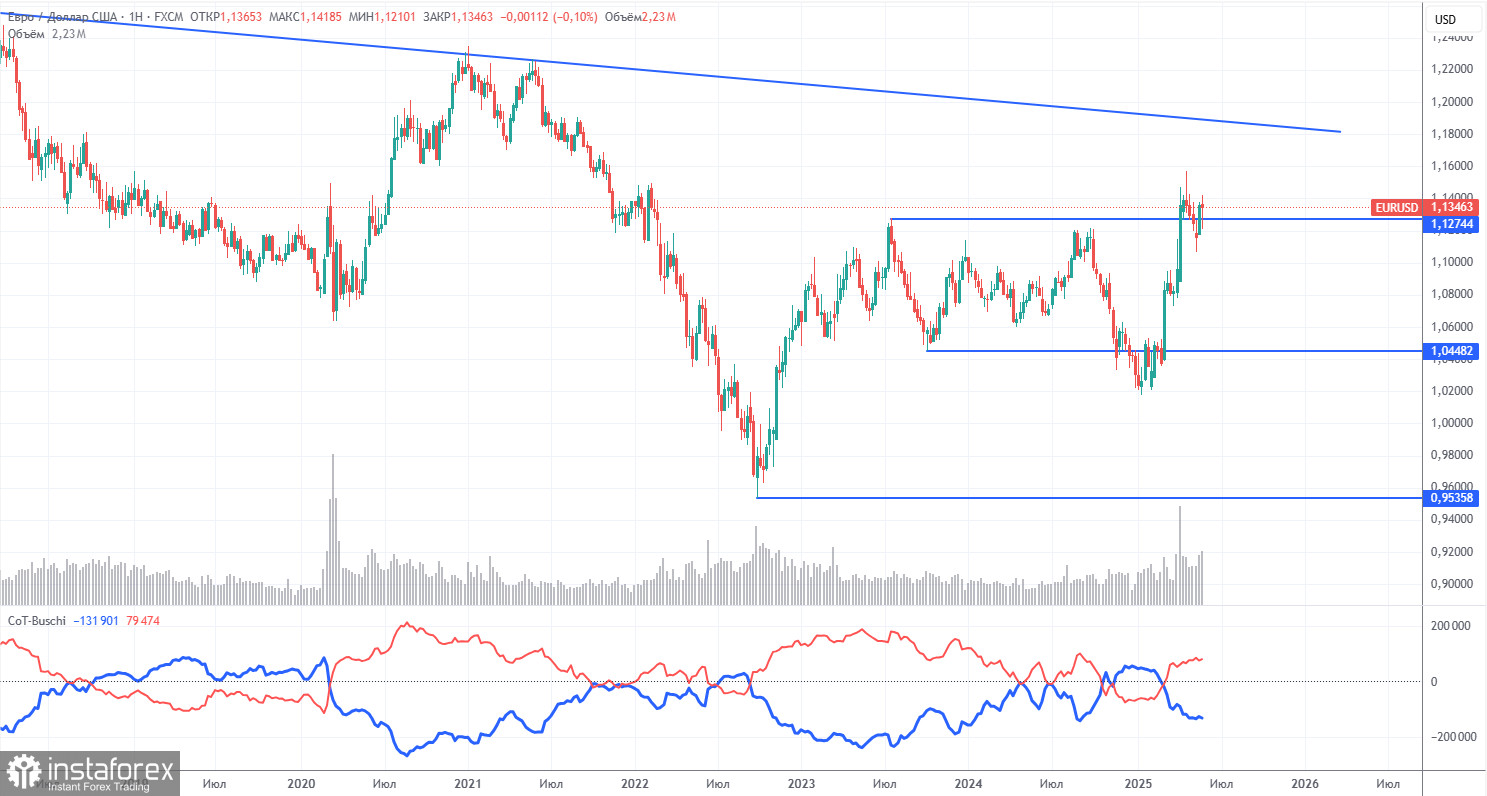
The latest COT report is dated May 27. The chart above shows that the net position of non-commercial traders was bullish for a long time; bears barely gained the upper hand at the end of 2024 but quickly lost it. Since Trump took office as U.S. president, the dollar has rapidly declined in value. We cannot be 100% certain that the dollar's decline will continue, but current global developments point precisely in that direction.
We still do not see any fundamental factors supporting the euro, but one decisive factor remains for the dollar's decline — Trump's trade wars. The global downtrend persists, but what value does a trend have now? The dollar might recover once Trump ends his trade wars — but will he end them? And when?
The red and blue lines have crossed again, so the market trend is again "bullish." Over the last reporting week, the number of long positions in the "Non-commercial" group decreased by 1,700, while shorts decreased by 6,700. Thus, the net position fell by 5,000 over the week. However, COT reports come with a one-week delay. At the moment, the market is actively buying EUR/USD again.
EUR/USD 1-Hour Analysis
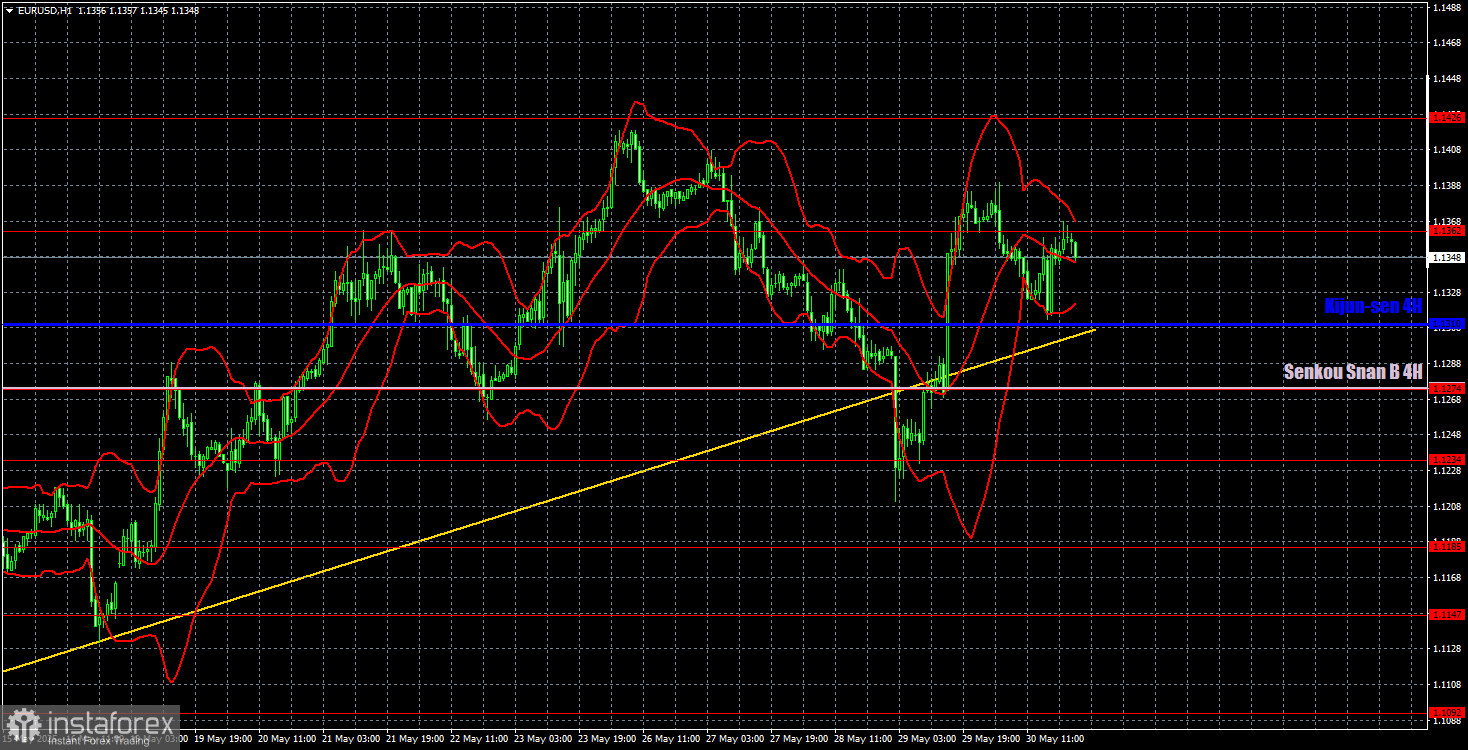
In the hourly timeframe, the EUR/USD pair maintains a local uptrend, part of a four-month trend. The U.S. dollar's prospects still depend on developments in the global trade war. If trade agreements are signed and tariffs reduced, the dollar may start to recover. However, no peace agreements are in place now; Trump continues to make strange decisions and statements that shock the market. The market continues to expect the worst and does not trust Trump.
For June 2, the key levels for trading are 1.0823, 1.0886, 1.0949, 1.1006, 1.1092, 1.1147, 1.1185, 1.1234, 1.1274, 1.1362, 1.1426, 1.1534, 1.1607, as well as the Senkou Span B (1.1275) and Kijun-sen (1.1310) lines. The Ichimoku indicator lines can shift during the day, which must be considered when determining trading signals. Don't forget to set a Stop Loss at breakeven once the price moves 15 pips in the correct direction — this protects against losses if the signal turns out to be false.
On Monday, the Eurozone and the U.S. are scheduled to publish manufacturing PMI indices, but who will care when Trump once again raises tariffs? Theoretically, only the ISM manufacturing index might trigger a market reaction, but it's unlikely to outweigh the market's overall desire to sell the dollar.
Illustration Explanations:
- Support and resistance price levels – thick red lines where movement may end. They are not trading signal sources.
- Kijun-sen and Senkou Span B lines—These are strong Ichimoku indicator lines transferred to the hourly timeframe from the 4-hour one.
- Extremum levels – thin red lines where the price has previously rebounded. These act as trading signal sources.
- Yellow lines – trend lines, trend channels, and other technical patterns.
- COT Indicator 1 on the charts – the size of the net position for each category of traders.